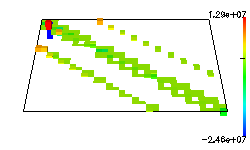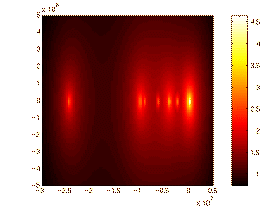

Click on image to get an enlarged version. Click on label to get an explanation.
| Structure Plot | City Plot |
|---|---|
 |
 |
| Spectral Portrait | 3D Interactive City Plot |
 |
[ VRML Version 2, gzipped ] 23441 bytes |
| Size | Type | |||||||||||||||||||||||||||||||||
|---|---|---|---|---|---|---|---|---|---|---|---|---|---|---|---|---|---|---|---|---|---|---|---|---|---|---|---|---|---|---|---|---|---|---|
| 30 x 30, 180 entries | real unsymmetric | |||||||||||||||||||||||||||||||||
| Nonzeros | ||||||||||||||||||||||||||||||||||
|
||||||||||||||||||||||||||||||||||
| Column Data | Row Data | |||||||||||||||||||||||||||||||||
| Average nonzeros per column : 6 Standard deviation : 2.3
|
Average nonzeros per row : 6 Standard deviation : 1.2
|
|||||||||||||||||||||||||||||||||
| Bandwidths | Profile Storage | |||||||||||||||||||||||||||||||||
|
Nonsymmetric skyline storage 324 |
|||||||||||||||||||||||||||||||||
| Heaviest diagonals | ||||||||||||||||||||||||||||||||||
Top 10 out of 11 nonvoid diagonals. |
Conditioning | |||||||||||||||||||||||||||||||||
|
||||||||||||||||||||||||||||||||||
| Set PORES | |
|---|---|
| Source: | John Appleyard, Harwell Laboratory |
| Discipline: | Reservoir modeling |
| Accession: | Summer 1980 |
[ Home ] [ Search ] [ Browse ] [ Resources ]
Last change in this page: Wed Sep 22 13:33:48 US/Eastern 2004 [Comments: ]