
 bcsstk02 |
 dw2048 |
 fidapm05 |
 qc324 |
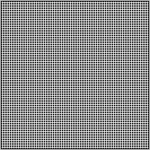
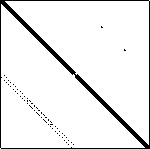
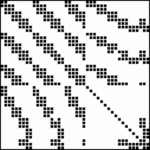
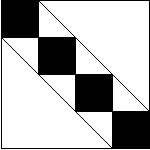
Structure plots provide a quick visual check on the sparsity pattern of the matrix. A structure plot is a rectangular array of dots; a dot is black if the corresponding matrix element is nonzero otherwise it is white. For an n by m matrix, the (1,1) matrix element is at the top left, while the (n,m) element is at the bottom right. Note that we use the term nonzero loosely here. For sparse matrices, we say an element is nonzero if its value is explicitly recorded in the file defining the matrix; the value in the file may actually be zero.
Producing high fidelity structure plots of fixed-size is quite difficult when the order of the matrix is not commesurate with the number of pixels used in the display. When the order of the matrix is smaller than the number of available pixels, more than one pixel is used to display a single matrix element. Scaling up the size of such an image can lead to plaid effects or fuzziness. These can be seen above where bcsstk0 (a 66x66 matrix) and fidapm05 (a 42x42 matrix) are displayed in 150x150 pixel arrays. Note that the detailed views of such matrices linked to by on matrix home pages are not constrained to a fixed size, and hence do not suffer from such artifacts.
At the other extreme, when the order of the matrix is much larger than the number of pixels used to display it, the matrix can appear denser than it is. For example, the matrix psmigr_3 is a 3140x3140 matrix with only 5.5% of its entries nonzero. However, the nonzeros are distributed fairly uniformly, and hence when it is scaled down to be much smaller than 3140x3140 pixels it looks quite dense.
Because of such difficulties matrix structure plots should only be used to obtain a rough idea of the nonzero structure. We are working on methods to improve these visualizations.
The structure plots in the Matrix Market were produced using IBM Visualization Data Explorer, MATLAB, and xv.
[ Home ] [ Search ] [ Browse ] [ Resources ]
Last change in this page : 9 July 2002. [ ].