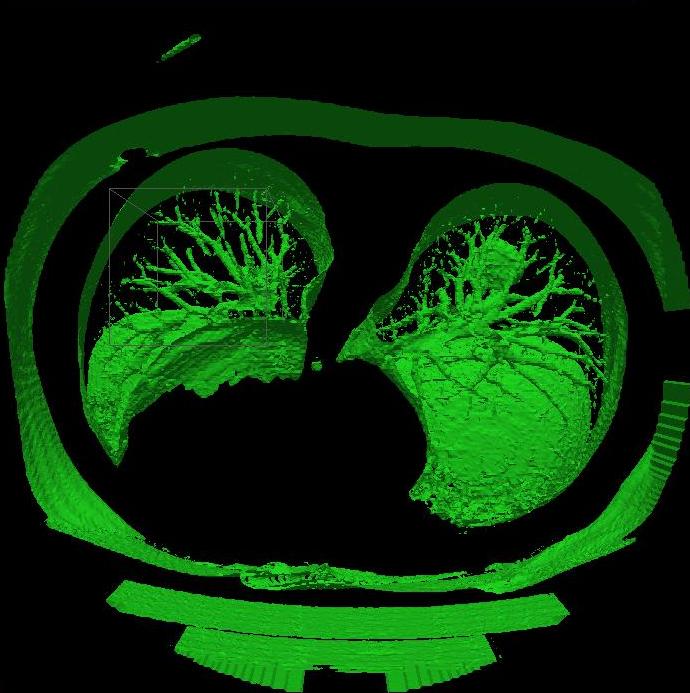
Computerized Tomographic (CT) imaging is used to diagnose a wide range of medical diseases. CT images give a 3-dimensional picture by detecting density differences between different features in the body. In this application, we are studying lung tumors and how to monitor their growth. Using visualization techniques, we have been able to characterize the edges of lung tumors in CT data, to get accurate measurements of tumor volume change.
Objects within the CT data, lung tumors for example, can be visualized by looking at isosurfaces within the 3-D data at isovalues equivalent to the surfaces of the tumors. We use a marching cubes type algorithm to produce sets of polygons to visualizes these surfaces. An isosurface is determined in each voxel of the grid. A linear approximation leads to triangular surfaces for visualization and a second order approximation leads to accurate tumor volume calculations for each voxel.
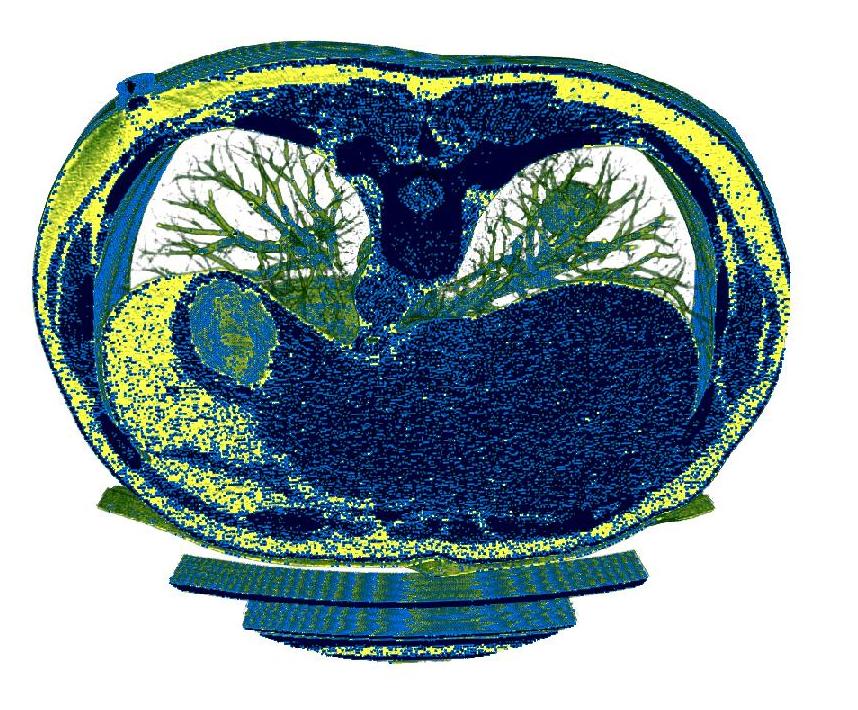
A 3D volume rendered visualization provides information about the CT
density inside or outside the chosen isosurface value. A "transfer
function" maps each density value to a color and opacity, from fully
opaque to fully transparent. Volume rendering is performed on a graphics
processing unit (GPU), to allow real-time visualization. In addition to
the polygonal isosurface
discussed above, the GPU renders a box around the CT volume. Rather than
render this box normally, the GPU runs a program for each pixel of the
box that traces a ray through the volume to numerically integrate a
composite color everything in the volume behind that pixel.
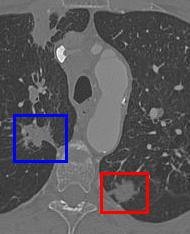
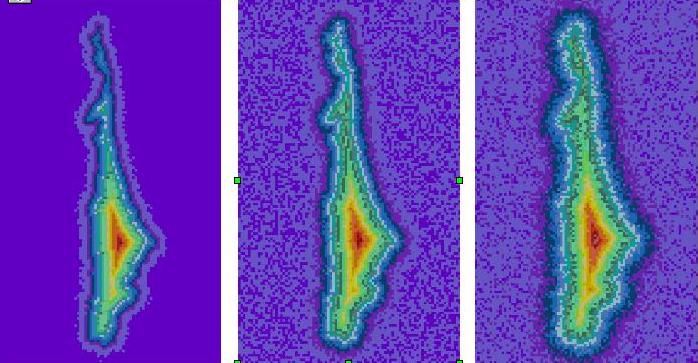
In order to compare different techniques that measure lung tumor volume change over time, well characterized reference data sets are necessary. Phantom lung tumors have been synthesized for this purpose, but do not provide realistic data. By characterizing lung tumor data, we have been able to insert realistic synthetic tumors into CT data to provide challenging volume measurement reference data.
Through visualization, we are able to characterize the quality of biological images. Working with cell images that were created under a variety of imaging conditions, we have defined metrics to describe image quality.
 |
Adele Peskin , Karen Kafadar, Alden Dima , Javier Bernal and David Gilsinn, Synthetic Lung Tumor Data Sets for Comparison of Volumetric Algorithms in The 2009 International Conference on Image Processing, Computer Vision, and Pattern Recognition, Las Vegas, NV., July 13-16, 2009.
|
|
Adele Peskin , Karen Kafadar, A. M. Santos and Gillian Haemer, Robust Volume Calculations of Tumors of Various Sizes in The 2009 International Conference on Image Processing, Computer Vision, and Pattern Recognition, Las Vegas, NV., July 13-16, 2009.
|
|
Adele Peskin and Alden Dima , Modeling Clinical Tumors to Create Reference Data for Tumor Volume Measurement in The 6th International Symposium on Visual Computing 2010, Las Vegas, NV., November 22-December 1, 2010.
|
|
Adele Peskin , Karen Kafadar and Alden Dima , A Quality Pre-Processor for Biological Cell Images in "Computational Bioimaging 2009, 5th International Symposium on Visual Computing, Las Vegas, NV., November 30-December 2, 2009.
|
|
Adele Peskin , Alden Dima , J. Chalfoun and John Elliot, Predicting Segmentation Accuracy for Biological Cell Images in The 6th International Symposium on Visual Computing 2010, Las Vegas, NV., November 22-December 1, 2010.
|
|
J. Chalfoun, Alden Dima , Adele Peskin , John Elliot and J. Filliben, A Human Inspired Local Ratio-Based Algorithm for Edge Detection in Fluorescent Cell Images in The 6th International Symposium on Visual Computing 2010, Las Vegas, NV., November 22-December 1, 2010.
|
|
|
|
|
 |
| The same cell imaged under different imaging conditions show a range of edge quality. |
|
|
|