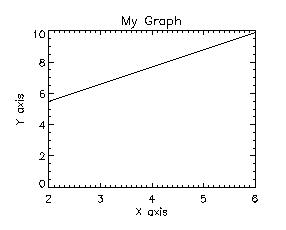
Plot, xvalues, yvalues, XTitle='X axis', $
YTitle='Y axis', Title='My Graph'
CharSize is the keyword that changes the size of the font. The default value is "1" which provides a normal sized font. You can increase or decrease it with decimals such as 1.5.
Here are 3 ways that accomplish the same task--to make a graph with
"normal-sized" characters:
Plot, xvalues, yvalues, XTitle='X axis', $
YTitle='Y axis', Title='My
Graph'
Plot, xvalues, yvalues, XTitle='X axis', $
YTitle='Y axis', Title='My
Graph', $
CharSize=1
Plot, xvalues, yvalues, XTitle='X axis',$
YTitle='Y axis', Title='My
Graph', $
/CharSize
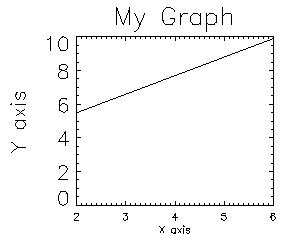
The code shown above created this graph. Using !P.CharSize at
the beginning changes the the size of all plot annotations to 2X the normal
size (see the graph title, 'My Graph'). In this case, I chose to
change the X and Y axis annotation sizes to demonstrate the proper syntax.
With the X axis, I had to use an XCharSize of 0.5 to make it "normal" in
size because the system has been set to 2. Half of 2 is 1, which
is "normal." The YCharSize was made 1, but since it the system size
is 2, 1 x 2 = 2 and the text is large. Note that the size of the
numbers corresponding to axis ticks are the same size as the axis labels.
See axis title example to learn how to make the
axis titles larger than the axis values.
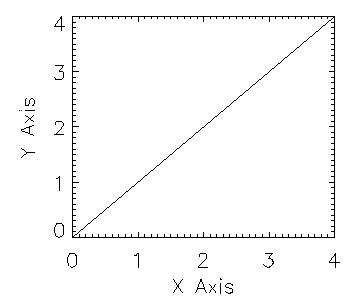
This is the default:
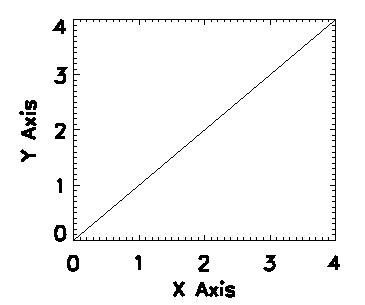
x=findgen(5)And this is what the graph looks like with thicker characters:
y=findgen(5)
!p.charsize=2
plot, x,y, xtitle='X Axis', ytitle='Y Axis'
x=findgen(5)
y=findgen(5)
!p.charsize=2
plot, x,y, xtitle='X Axis', ytitle='Y Axis', CharThick=10