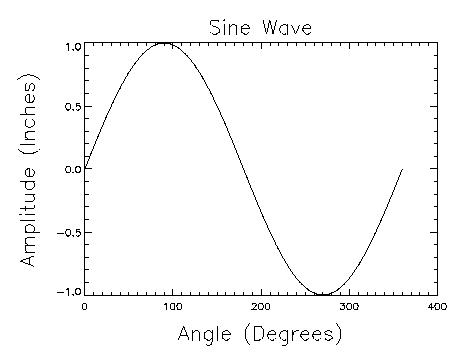
Here is an example provided by IDL Tech Support that plots axis titles with characters that are larger than the characters forming the axis values.
pro ex_PLOT_w_titlesHere are come comments that might explain the above code a little more clearly:; Creating data.
x = FINDGEN(361)
y = SIN(!DTOR*x); Setting PLOT position and offsets.
; Set variables to percentages
xll_pos = 0.2 ;x11_pos is the position of x at the lower left (in %)
yll_pos = 0.2 ;y11_pos is the position of y at the lower left (in %)
xur_pos = 0.9 ;xur_pos is the position of x at the upper right (in %)
yur_pos = 0.9 ;yur_pos is the position of y at the upper right (in %); Apply the variables to a plot position, later used when the POSITION keyword
; is used
plot_pos = [xll_pos, yll_pos, xur_pos, yur_pos]; These two positions are used for locating the strings used for axis titles
xmed_pos = (xur_pos + xll_pos)/2.
ymed_pos = (yur_pos + yll_pos)/2.; These offsets just help get everything aligned
x_offset = 0.1
y_offset = 0.025; PLOTting data. (See position.htm)
PLOT, x, y, POSITION = plot_pos; Using XYOUTS to place titles on the PLOT.
XYOUTS, xmed_pos, yur_pos + y_offset, 'Sine Wave', $
CHARSIZE = 2.0, ALIGNMENT = 0.5, /NORMAL
XYOUTS, xmed_pos, yll_pos - (5*y_offset), $
'Angle (Degrees)', CHARSIZE = 2.0, $
ALIGNMENT = 0.5, /NORMAL
XYOUTS, xll_pos - x_offset, ymed_pos, $
'Amplitude (Inches)', CHARSIZE = 2.0, $
ALIGNMENT = 0.5, ORIENTATION = 90., /NORMALend
In the above section of code I am making a vector (plot_pos) to equate
to POSITION keyword used with the PLOT procedure. I could have
written
this vector as follows
plot_pos = [0.2, 0.2, 0.9, 0.9]Moreover, I could directly set the POSITION keyword to this vector as
PLOT, x, y, POSITION = [0.2, 0.2, 0.9, 0.9]