Visualizing Cloud Computing Simulations

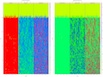
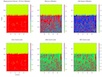
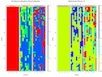
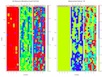
These images are a variety of information visualizations in support of a simulation of cloud computing, being developed by Kevin Mills and others, examining resource allocation issues.

Experiments with TreeMaps for Sensativity Analysis Variables

Experiments with parallel coordinates to display user runs for sensativity analysisMI Slider MI 47

Using parallel coordinates to visualize SA results (needs wide display) 9 key behavioral responses

Koala v7 variable browser to browser through the many sensativiy analysis parameters

Genetic Algorithm Experiment visualized as set of parallel coordinates, using D3.js

Genetic Algorithm visualized via R (in 3D) for experiment 4c

VRML file of generation 23 (last) for experiment 4c (exported and processed with R)

Genetic Algorithm driving Koala simulator (100 generations)