Visualization of Complex Functions
Motivation
Effective visualizations can help researchers obtain a more complete understanding of high level
mathematical functions that arise in many applications, but designing software to plot complicated
3D surfaces can be a challenging task. The function data must be computed accurately,
the plot must capture important surface features, and the visualization should be accessible
to users on a variety of platforms. Using techniques from numerical grid generation and various
technologies, including the Virtual Reality Modeling Language (VRML) and Extensible 3D (X3D), we
have been able to address most of these issues to produce precise and informative visualizations.
Function Evaluation
A key concern when constructing plots of complicated mathematical functions is accuracy, in both the data
and the plot itself. For the DLMF project we validated the data by computing function values using
at least two independent methods. This involved the use of standard computer algebra packages,
routines from commercial libraries and free repositories, or the personal Fortan and C codes of the chapter
authors.
Plot accuracy concerns the visual display of the data. An accurate visual representation of the function depends
not only on the accuracy of the data, but also on the plotting tool or package. Commercial packages often have
many built-in special functions, but their 3D plots are usually over a rectangular mesh, often leading to
poor or misleading graphs. When function values lie outside the range of interest, many packages have trouble
properly clipping the function surface. Furthermore, even when the plot looks satisfactory inside a package,
it may be completely unacceptable when the data is transformed to other formats.
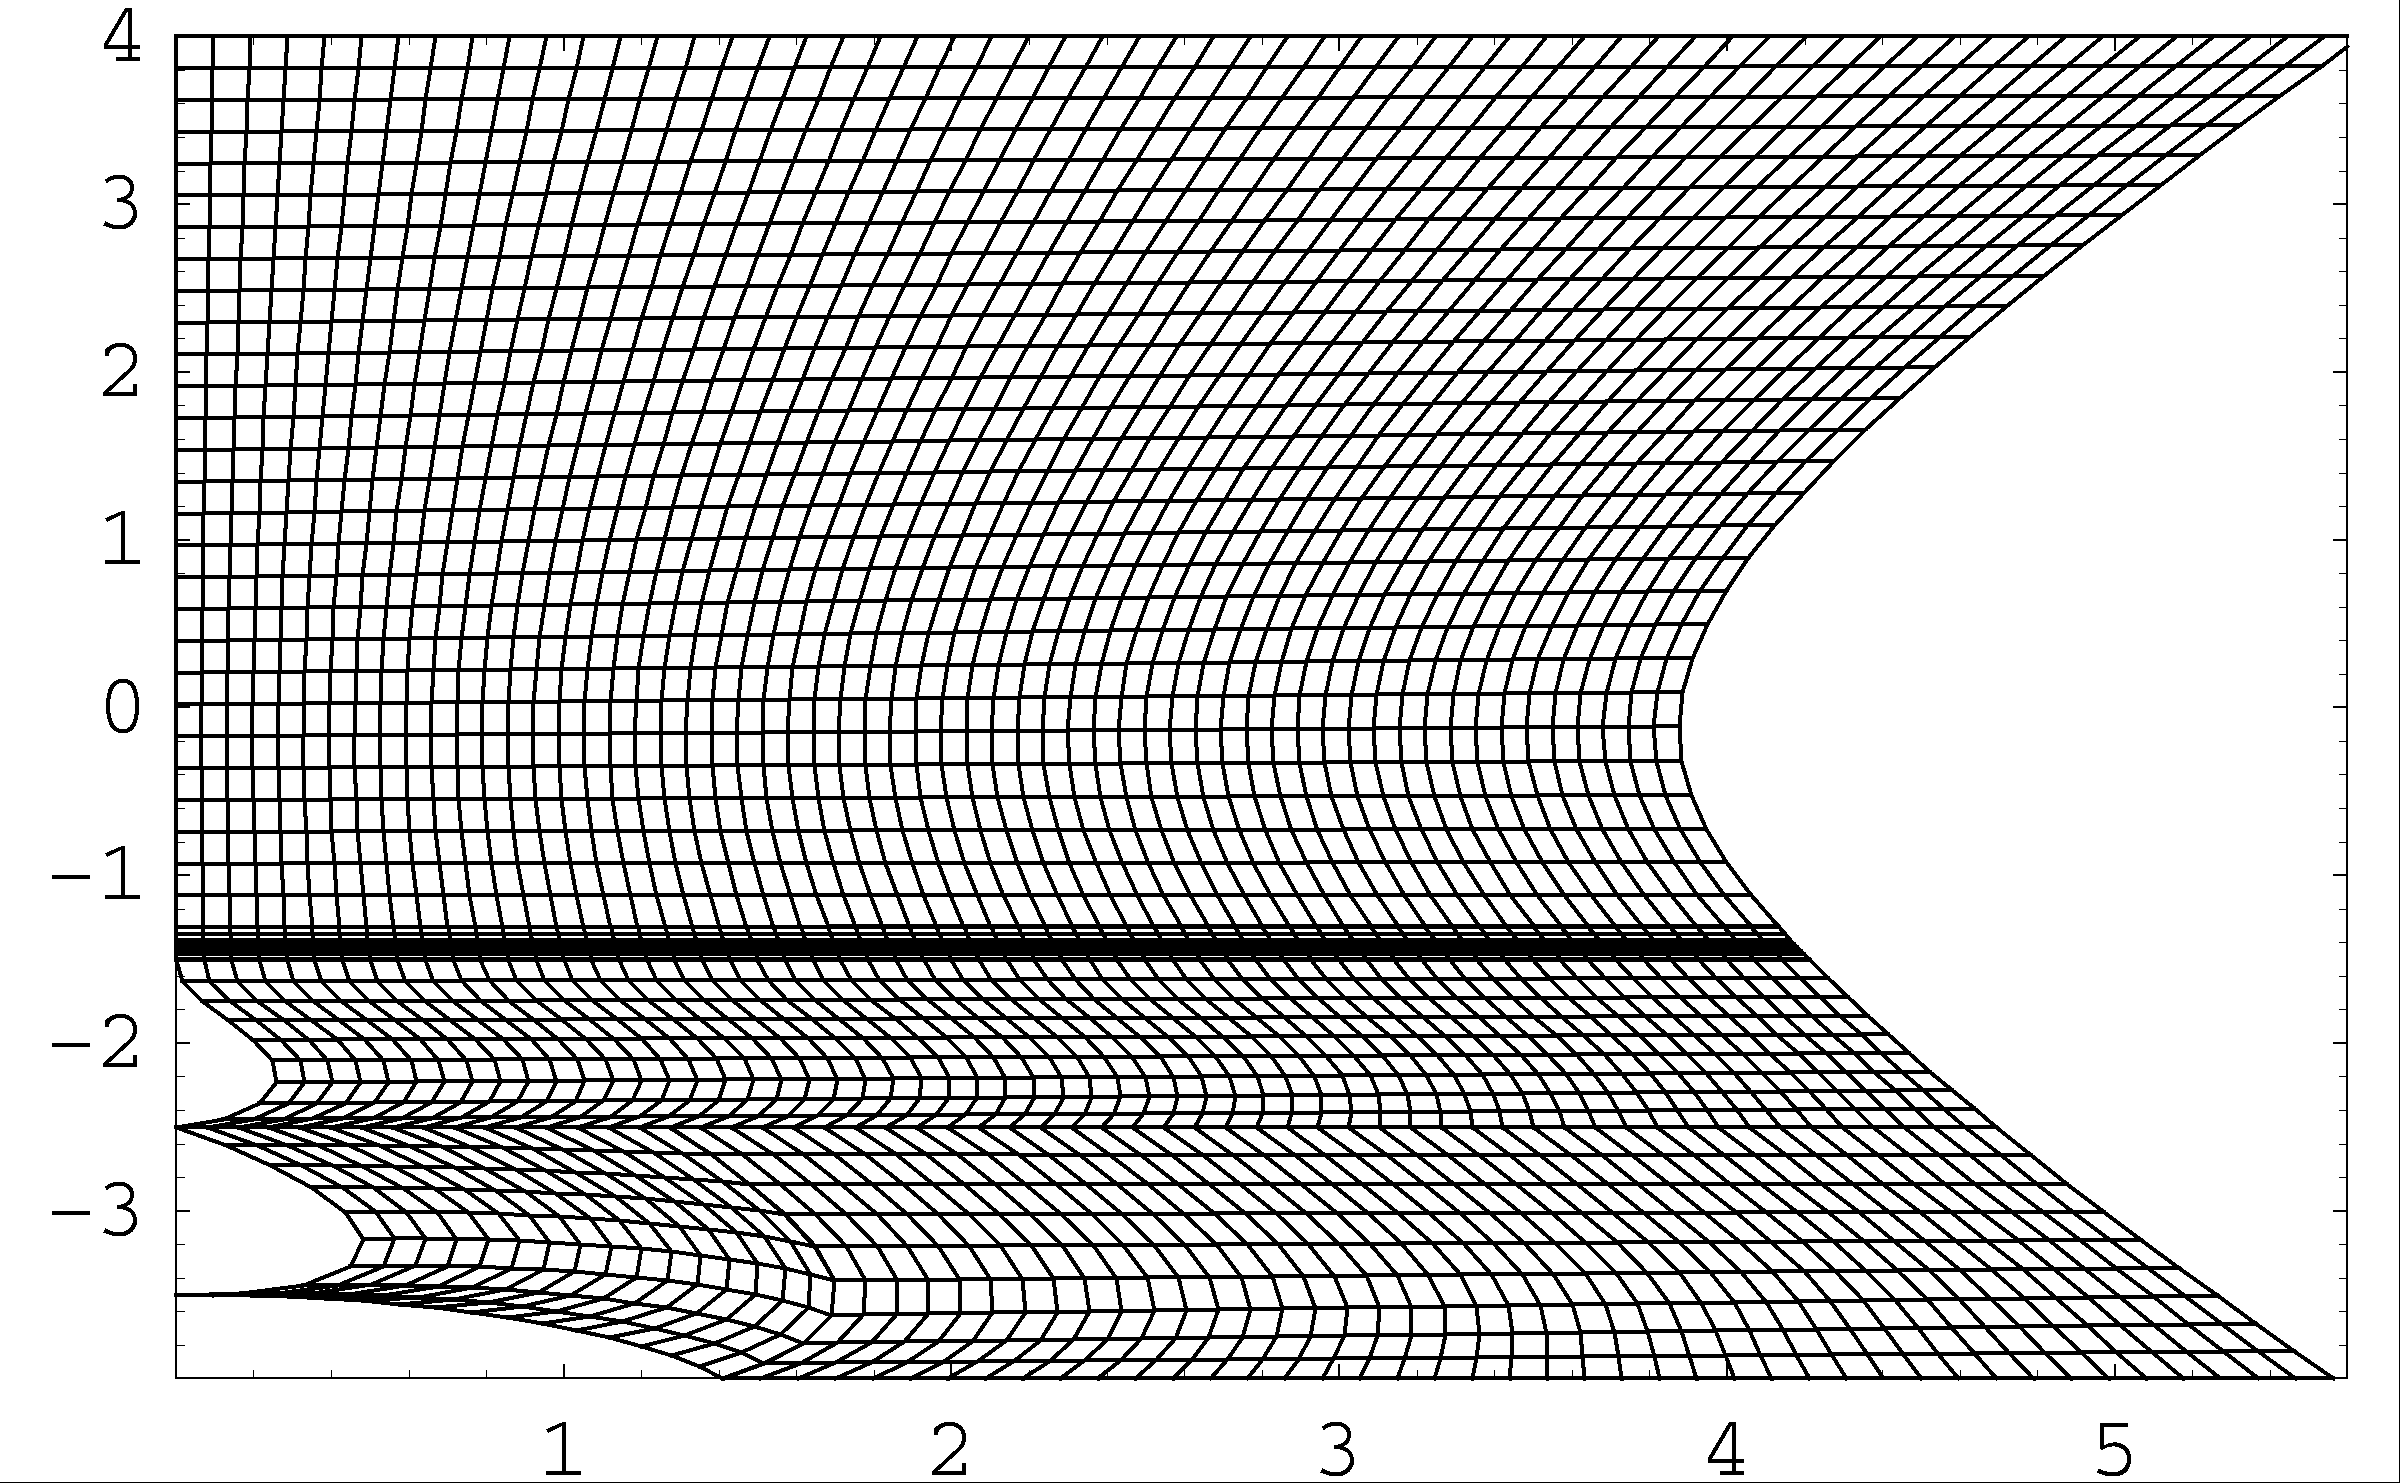
We have solved many of these problems using techniques of numerical grid generation, such as transfinite
blending function interpolation and a modified tensor product spline generator, to design customized meshes
fitted to selected contours of the function. By computing the function values over such a mesh, we can
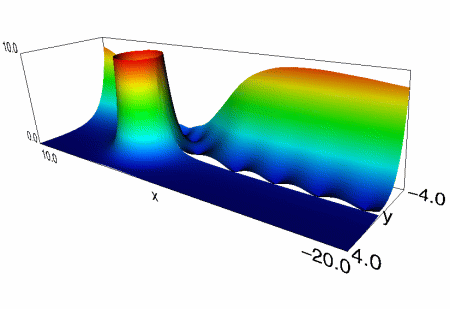
accurately represent key function features as shown in the graph of the Hankel function above
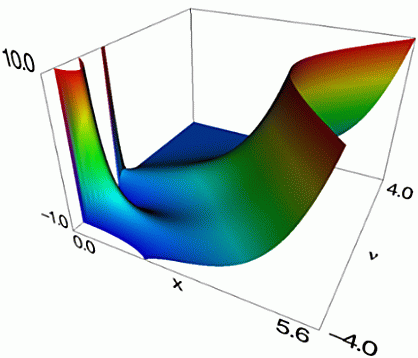
and in the grid and plot of a Struve function below.
VRML/X3D
Once we have the plot data, we can translate the data into a format that allows viewing on the web. For the
DLMF project we used the Virtual Reality Modeling Language (VRML) and later also converted the files to
X3D (Extensible 3D). VRML is a standard 3D file format for which browsers and plugins are publicly available
for a variety of platforms. X3D is an emerging technology, providing an XML(Extensible Markup Language) type
graphics format. Standard VRML/X3D controls allow a user to rotate, zoom, and pan a
3D display, but we have added other capabilities such as dynamic cutting plane control, color map control, and
scale control. The plots of the Hankel and Struve functions above are actually snapshots of the VRML visualizations
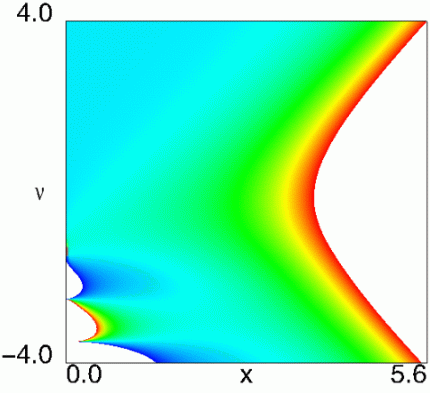
that can be seen in the DLMF. The picture below shows a density plot of the Struve function obtained by scaling the
surface down close to zero in the vertical direction.
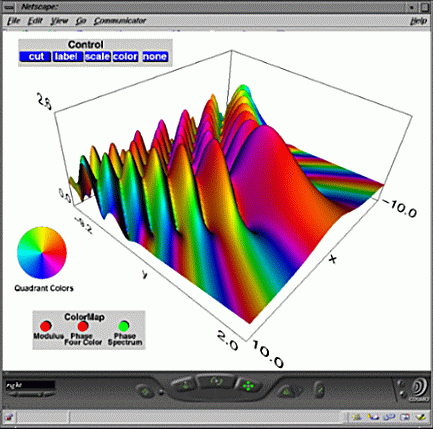
The snapshot below is the modulus of a complex Pearcey integral function with a phase color map. The picture
shows some of our customized control panels along with a VRML browser dashboard.
Go to the Digital Library of Mathematical Functions for a preview version
of the DLMF. The Airy and Gamma function chapters contain 3D visualizations. Click on the "Help" link near a
3D figure if you need assistance obtaining a VRML browser.
Disclaimer
The identification of commercial software products on this web site does
not imply recommendation or endorsement by the National Institute of Standards
and Technology, nor does it imply that the products are among the best
available for the purposes they serve.
Last modified: December 4, 2009. Send comments and suggestions to
Bonita V. Saunders ([email protected]).


