


Next: Credits
Up: C++ source code debuggers
Previous: Introduction to the LLVM
Debugging OOMMF in Visual Studio
The debugger built into Microsoft's Visual Studio provides largely
similar functionality to gdb and lldb, but with a GUI
interface. It understands the debugging symbol files produced by the
Visual C++ cl compiler, namely ``Program DataBase'' files
having the .pdb extension. Other debugger options for this symbol
file format include the GUI WinDbg mentioned earlier, and the
related command line tool CDB.
Visual Studio is an integrated development environment, and normal usage
involves building ``projects'' that specify all the source code files
and rules for building them into an executable program. OOMMF does not
follow this paradigm, but rather maintains similar information in a
collection of Tcl makerules.tcl files distributed across the
development tree. Thus there is no OOMMF project file to load into
Visual Studio. Instead, to debug an OOMMF application in Visual Studio
you need to load the application executable directly, along with some
supplemental run information. The following details the process for
Visual Studio 2022; specifics may differ somewhat for other releases.
- Launch Visual Studio
- Select Open a project or solution from the Getting
started pane and then navigate to and select the executable.
- In the Solution Explorer pane, right click on the executable
and select Properties.
- Under Parameters, fill in the Arguments and Working
Directory fields as appropriate. You may also have to modify the
Environment setting, in particular if the Tcl and
Tk .dll's are not on the default path used by Visual
Studio. In this case click on the ellipsis at the right of the
Environment row, and then click the Fetch button at the
bottom of the Environment pop-up to load the current
environment. Scroll down to variable path and edit as necessary.
Close when complete.
- Select Start from the toolbar or Debug|Start Debugging
from the top-level menu bar.
- Debug! You can use the drop-down menus to perform actions
analogous to those described above for the gdb and lldb
debuggers. If you get a message that no symbols were loaded, then most
likely either the /Zi switch was missing from the compile command
or else the /DEBUG option was missing from the link command. In
this case review the OOMMF configuration file
settings) and rebuild OOMMF. The symbols
for the executable should be stored in a *.pdb file next to the
executable file.
- The call stack should automatically appear when you start
debugging. If not, you can manually call it up through the menu option
Debug|Windows|Call Stack. A curious feature of Visual Studio
is that the call stack window disappears when execution exits. This
happens even when the exit is caused by an abnormal event, for example
via an assertion failure. In default OOMMF builds many types
of fatal errors are routed through the
Oc_AsyncError::CatchSignal(int) routine in
pkg/oc/ocexcept.cc. If you set a breakpoint in this function then
the debugger will stop if it hits this function, but will not exit the
debugger, so you can still examine the call stack. Do this before you
start the debugging run by pulling up the Debug|New
Breakpoint|Function Breakpoint... dialog, enter
Oc_AsyncError::CatchSignal(int) in the ``Function Name'' box,
and click ``OK''.
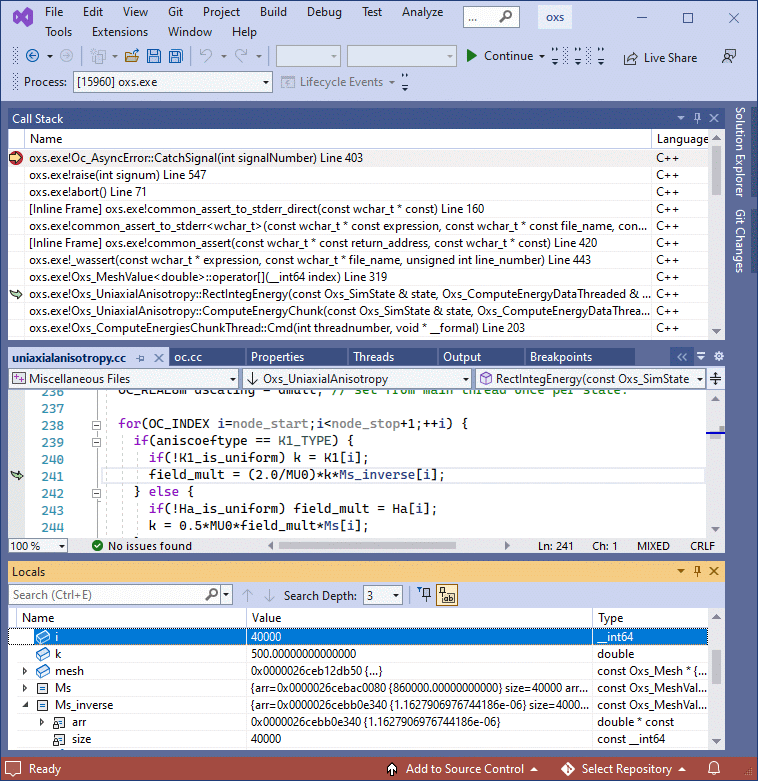
- Double-clicking on a row in the Call Stack window will bring up
the relevant line of source code. Menu option
Debug|Windows|Locals will open a window showing the variable
values accessible at this point in the code. An example is shown in
the figure below, where we
see that the index variable i at line 241 of
uniaxialanisotropy.cc has value 40000, but the size of
Ms_inverse is 40000, meaning the maximum valid index into
Ms_inverse is only 39999.
- When you exit the debugger you will be asked if you want to save the
.sln (solution) file. If you do, it will be written in the same
directory as the executable and .pdb files. In later debugging
sessions you can load the solution file in step 2 above and bypass
steps 3 and 4.
Figure 5.9: Visual
Studio Debugger screenshot displaying call stack, source code, and
local variables from a debugging session.
OOMMF Documentation Team
September 27, 2023