5.4 Segfaults and other asynchronous termination
If an OOMMF application suddenly aborts without displaying an error message, the most likely culprit is a segfault caused by attempted access to memory outside the program’s purview. If this occurs while running oxsii or boxsi, the first thing to check is the oxsii.log and boxsi.log log files in the OOMMF root directory. If there are no hints there, and the error is repeatable, then you can enable core dumps and re-run the program until the crash repeats. You can then obtain a stack trace from the core dump to determine the origin of the failure.
On Linux, enable core dumps with the shell command ulimit -Sc unlimited, and then run ulimit -Sc to check that the request was honored. If not, then ask your sysadmin about enabling core dumps. (Core dumps can be rather large, so after analysis is complete you should disable core dumps by running ulimit -Sc 0 in the affected shell, or else exit that shell altogether.) Once core dumps are enabled, run the offending application from the core-dumped enabled shell prompt. When the application aborts an image of the program state at the time of termination is written to disk. The name and location of the core dump varies between Linux distributions. On older systems the core file will be written to the current working directory with a name of the form core.<pid>, where <pid> is the pid of the process. (If the process is oxsii or boxsi then the working directory will be the directory containing the .mif file.) Otherwise, use the command sysctl kernel.core_pattern to determine the pattern used to create core files. If the pattern begins with a | “pipe” symbol, then the core is piped through the indicated program, and you will have to check the system documentation for that program to figure out where the core went!
If the core was piped through systemd-coredump, then you can use the coredumpctl utility to gain information about the process. (More on this below.) Some Linux variants, for example Ubuntu, use apport, but may configure it to effectively disable core dumps for executables outside the system package management system. In this case you might want to install the systemd-coredump package to replace apport, or else use sysctl to change kernel.core_pattern to a simple file pattern (e.g., /tmp/core-%e.%p.%h.%t).
If you have a core dump, you can run the GNU debugger gdb on the executable and core dump to determine where the fault occurred:
$ cd app/oxs
$ gdb linux-x86_64/oxs /tmp/core.12345
Program terminated with signal 11, Segmentation fault.
#0  0x00000000005a40da in Oxs_UniaxialAnisotropy::RectIntegEnergy
  (Oxs_SimState const&, Oxs_ComputeEnergyDataThreaded&,
  Oxs_ComputeEnergyDataThreadedAux&, long, long) const ()
(gdb) bt
#0  0x00000000005a40da in Oxs_UniaxialAnisotropy::RectIntegEnergy
  (Oxs_SimState const&, Oxs_ComputeEnergyDataThreaded&,
  Oxs_ComputeEnergyDataThreadedAux&, long, long) const ()
#1  0x00000000005a6fed in Oxs_UniaxialAnisotropy::ComputeEnergyChunk
  (Oxs_SimState const&, Oxs_ComputeEnergyDataThreaded&,
  Oxs_ComputeEnergyDataThreadedAux&, long, long, int) const ()
#2  0x000000000040ce44 in Oxs_ComputeEnergiesChunkThread::Cmd(int,
   void*) ()
#3  0x00000000004697bd in _Oxs_Thread_threadmain(Oxs_Thread*) ()
#4  0x00007f90ea7fb330 in ?? () from /lib64/libstdc++.so.6
#5  0x00007f90ea019ea5 in start_thread () from /lib64/libpthread.so.0
#6  0x00007f90e9d42b0d in clone () from /lib64/libc.so.6
(gdb) quit
(For visibility, shell commands are colored cyan, and gdb commands are red. The gdb commands are also prefixed with the (gdb) prompt. For example, “bt” above invokes the gdb “backtrace” command.) We see that the segmentation fault occurred in the member routine RectIntegEnergy of class Oxs_UniaxialAnisotropy, called by ComputeEnergyChunk, and so on. If oxs had been built with debugging symbols (cf. configuration files), then the stack trace would include the corresponding source code files and line numbers.
If the core dump was journaled by systemd-coredump, then the command coredumpctl list will list all available core dumps, including a timestamp, the pid, and the name of the executable. You can get a stack trace with coredumpctl info <pid>, or load the core dump directly into gdb with coredumpctl gdb <pid>. (Some versions of coredumpctl want “debug” in place of “gdb” in that command; check your system documentation for details.)
On macOS, crash reports are automatically generated and can be viewed from the macOS Console app. Select “User Reports” or “Crash Reports” from the left hand sidebar, and select the crashed process. The report provides details about the run, including a stack trace.
You can also create core files on macOS in a very similar way as on Linux. Set ulimit -Sc unlimited and run the application. Core files are written to the directory /cores/, with naming convention core.<pid>. If you built OOMMF with g++, then you can obtain a stack trace with gdb as above. (Note that in MacPorts the gdb executable is named ggdb.) If you built with clang++ then you may want to use the LLVM lldb debugger, which should be included with the clang++ package. Here is an example lldb session, for an oxs executable built with debugging symbols:
% cd app/oxs
% lldb -c /cores/core.54416 darwin/oxs
(lldb) target create "darwin/oxs" --core "/cores/core.54416"
Core file ’/cores/core.54416’ (x86_64) was loaded.
(lldb) bt
* thread #1, stop reason = signal SIGSTOP
 * frame #0: 0x0000000103cfc188 oxs‘Oxs_UniaxialAnisotropy::RectIntegEnergy
 (this=0x00007ff0f4801000, state=0x00007ff0f350e830, ocedt=0x00007ffeec35a9a8,
 ocedtaux=0x00007ff0f350e6a0, node_start=16384, node_stop=20000) const at
 uniaxialanisotropy.cc:246
   frame #1: 0x0000000103cfd864 oxs‘Oxs_UniaxialAnisotropy::ComputeEnergyChunk
 (this=0x00007ff0f4801000, state=0x00007ff0f350e830, ocedt=0x00007ffeec35a9a8,
 ocedtaux=0x00007ff0f350e6a0, node_start=16384, node_stop=20000, (null)=0)
 const at uniaxialanisotropy.cc:454
   frame #2: 0x00000001038a1739 oxs‘Oxs_ComputeEnergiesChunkThread::Cmd
 (this=0x00007ffeec35b440, threadnumber=0, (null)=0x0000000000000000) at
 chunkenergy.cc:199
   frame #3: 0x00000001039eabaf oxs‘Oxs_ThreadTree::LaunchTree
 (this=0x0000000103ef3860, runobj=0x00007ffeec35b440, data=0x0000000000000000)
 at oxsthread.cc:856
[...]
(lldb) quit
Similar to the gdb example, the debugger prompt is “(lldb)”, and “bt” requests a stack trace.
To create and examine core dumps on Windows, download and install ProcDump and either WinDbg or Visual Studio applications from Microsoft. To get symbols in the process dump file you will need to build OOMMF with symbols, i.e., include
Oc_Option Add * Platform cflags {-debug 1}
in the config/local/options.tcl. Also, since -def NDEBUG is not included on this line, the C macro NDEBUG will not be defined, which enables code assert statements and other consistency checks, including in particular array bound checks for Oxs_MeshValue arrays.
You can create an oxs process dump by
> cd app\oxs
> procdump -ma -t -e -x . windows-x86_64\oxs.exe boxsi.tcl foo.mif
On program exit (termination, -t) or unhandled exception (-e) procdump will write a full dump file (-ma) to oxs.exe_YYMMDD_HHMMSS.dmp in the app/oxs directory.
Follow this procedure to examine the dump file in WinDbg:
-
1.
Launch WinDbg.
-
2.
Use the menu item File|Open Crash Dump... to load the .dmp file.
-
3.
Then View|Call Stack will open a call stack window.
-
4.
Double-clicking on a call stack frame will highlight the corresponding line of code in the C++ source. By default only the upper portion of the call stack is displayed, which may be just system exit handling code. You may need to click the “More” control in the toolbar one or more times and scroll down to reach OOMMF routines. Enable the “Source” toolbar option to include filenames and line references in the stack list.
-
5.
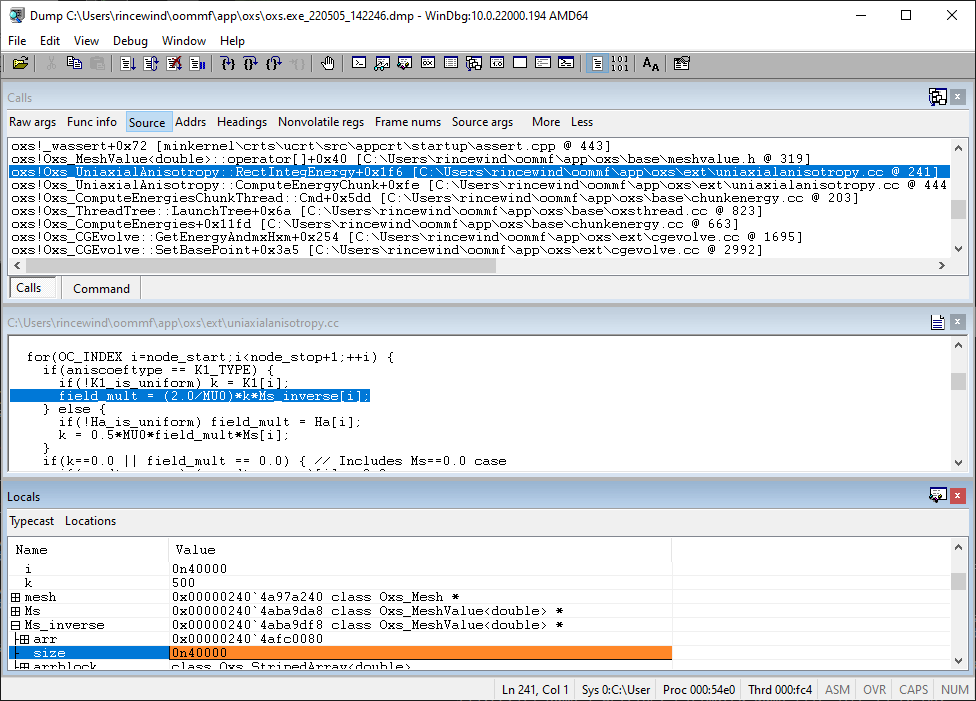
You can examine variable values at the time of the crash by opening the View|Locals window. Referring to the the source code and local variable windows in the figure below, we see that the index variable i has value 40000, but the size of the Ms_inverse array only has size 40000. Thus the access into Ms_inverse on line 241 (highlighted) is one element beyond the end of the array.
An alternative to WinDbg is to use the debugger built into Visual Microsoft’s Visual Studio:
-
1.
Launch Visual Studio.
-
2.
Select the Continue without code option (below the “Get started” column).
-
3.
Select File|Open|File ..., and load the *.dmp file.
-
4.
Under “Actions” in the “Minidump File Summary” window, select Debug with Native Only.
-
5.
If not automatically displayed, bring up Debug|Windows|Call Stack.
-
6.
Double-clicking in the call stack will bring up and highlight the corresponding line of code in the C++ source.
-
7.
Use the Debug|Windows|Autos and Debug|Windows|Locals menu items to display variable values.