ITLACMDScientific Applications  Visualization Group
Scientific Visualization
Attractive Image NIST
 
Up Visualization Parallel Computing Data Mining Released Software

Visualization of Network Dynamics


This page is currently under construction and it will be expanded later.

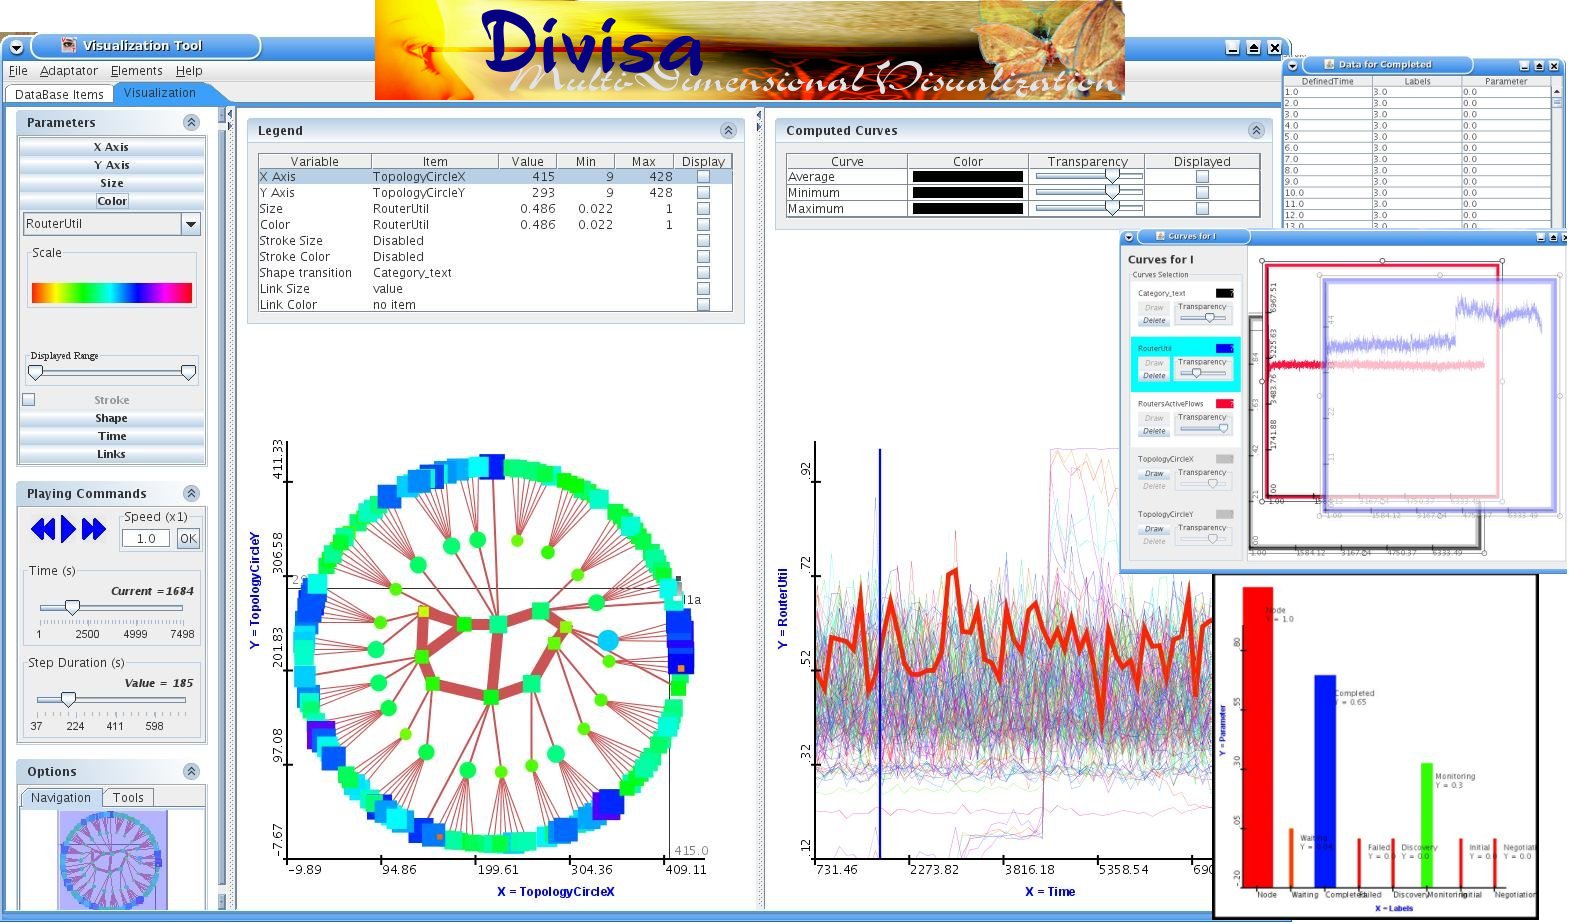
In order to gain insight into data collected from networks and network simulations, we have developed an information visualization tool called DiVisa.

DiVisa is a multi-dimensional visualization tool developed for researchers to understand the behavior of their data. From raw data, the user can interact with the visualization in order to obtain different "points of views" and thus to extract more information from the data. Geometrical forms such as squares, ellipses or lines are associated with data and visual attributes such as position, size, shape, color, stroke are used to represent different dimensions. Indeed, the researcher can easily modify the associations between data items and visual attributes, apply mathematical functions on and between items, subset and zoom in on areas, data ranges, or times of interest, superpose curves with transparency to compare them, and animate the visualization to show time series data. Moreover, the program can read any kind of data (simulation, statistics, text or numeric, etc.), and converters have been implemented to read several data formats without need for reformatting.


(bullet) Cedric Houard
(bullet) John Hagedorn
(bullet) Kevin Mills
(bullet) Group Leader: Judith Terrill


Please click on the image to see a full-resolution version.


	Figure 1: 
	One frame from an animated visualization of a 
	simulation of the "Abilene" network. On the 
	left panel, the innermost nodes are the backbone 
	routers, the next ring represents the subnet 
	routers, and the outermost ring shows the 
	leaf routers. On the right panel, the time 
	series curves of the routers (one is currently 
	selected) are displayed. On the right side, 
	different options available: numeric data 
	display (top); superposed time series curves 
	(middle); and diagram view (bottom).
Figure 1: One frame from an animated visualization of a simulation of the "Abilene" network. On the left panel, the innermost nodes are the backbone routers, the next ring represents the subnet routers, and the outermost ring shows the leaf routers. On the right panel, the time series curves of the routers (one is currently selected) are displayed. On the right side, different options available: numeric data display (top); superposed time series curves (middle); and diagram view (bottom).


Privacy Policy | Disclaimer | FOIA
NIST is an agency of the U.S. Commerce Department.
Date created: 2008-06-27, Last updated: 2011-01-12.
Contact