A dendrite is a crystal with a tree-like branching
structure. In the current context, we are interested in metallic
dendrites formed when a metal, or an alloy of multiple metals, in
liquid form freezes. Other materials when frozen form crystals
consisting of dendritic (tree-like) branches, the most familiar
example being snowflakes. The study of the formation of metallic
dendrites through simulation is the subject of this research.
The micro-structures which form during the solidification
(freezing) of a material play an enormous role in the properties of
the solid material. In particular, during the solidification of an
alloy, the micro-segregation patterns (i.e. the distribution of one
alloy component in the other at a microscopic level) which result
during dendritic and/or cellular solidification of an alloy are of
substantial interest to the materials engineer. The goal of this
research is to advance the theory of solidification through the
development of portable high-performance parallel simulation and
visualization software using the phase-field model.
The success of these simulations is determined by the degree to
which these snapshots and animations correctly reflect the growth of
actual dendrites. In order to produce simulated dendrites of
sufficient size, and with the level of detail required, our goal is to
produce simulations on 3-dimensional grids of at least 1000^3 points.
For interactive use, we are also developing a system in which
simulations over smaller grids can be interactively steered in
order to more quickly explore, at a lower level of detail,
the parameter space of this simulation.
We simulate, in 3 dimensions, the freezing of a binary alloy,
such as an alloy consisting of nickel and copper. Each simulation
produce a series of regularly spaced (in time) snapshots of the
dendrites as they grow within a bounded volume. This volume is divided
into a number of discrete grid points for computational purposes.
Each snapshot consists of a pair of files, one containing the current
phase of the material, from 0.0 (liquid) to 1.0 (solid), at each grid
point and the other containing the relative concentrations of the two
metals in the alloy at each grid point.
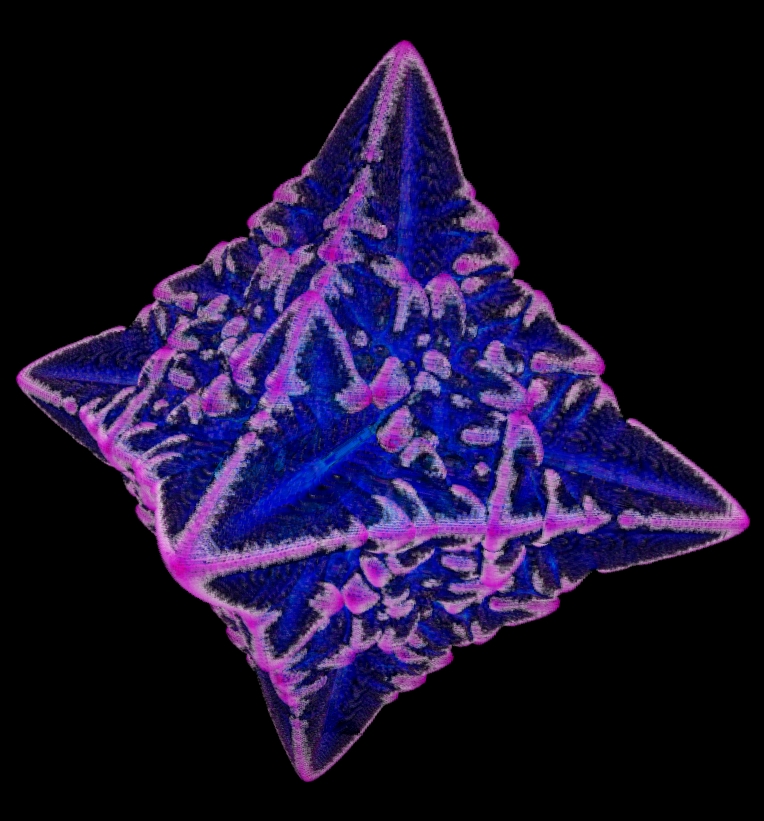
To visualize each snapshot, the phase value of 0.5 is taken as
the surface of the dendrite and an isosurface of the phase data is
computed. Color is added to the image based on the relative
concentration of the metals. For images of the dendrite, each point
on the computed isosurface is colored according to the corresponding
value in the 3D array of relative concentration data. Two dimensional
slices through the volume are also produced to show the internal
structure of the dendrites.
Once these images are generated they are saved individually and
then used together to produce animations
As our simulations are expanded to grids of 500^3 to 1000^3
points, the increased computation time and memory requirements for
computing the isosurfaces becomes a problem. No available
visualization software has been found that is able to perform these
larger isosurface computations. As a result, we are developing an
alternate technique for visualizing these dendrites. The first step in
this new technique is to convert each point in the phase data with a
value of 0.5 or higher into a 3-dimensional gylph. Each 3-dimensional
glyph consists of 3 orthogonal planar quadrilaterals (squares). All
three planes for each grid point are colored the same, according to
the corresponding grid point in the relative concentration data. For
display, the transparency of these planes can be varied to allow the
internal structure of the dendrite to also be visible. One of the
benefits of this approach is the ability to take advantage of advanced
visualization hardware that is designed to process such polygonal data
efficiently.