High Performance Concrete is concrete designed to exceed the performance of ordinary concrete.
Concrete is the most widely used building material. Any
improvement in the design of this material, for example, cost,
durablity, or strength, ripples through the economy.
This research is focused on advancing our fundamental understanding of the rheological properties of suspensions.
We are exploring how particle shape and size distribution, as well as how inter-particle forces and their
manipulation, effect the properties of suspensions in both Newtonian and non-Newtonian fluids. The simulation code,
which is under active development, uses a Dissipative particle Dynamics algorithm in a highly parallel implementation
to study large suspension systems with up to 75,000 inclusions (suspended particles) and over one million
mesoscopic fluid particles.
The computation of inter-inclusion forces takes into account the relative velocities of the inclusions as well as the
local surface curvature and surface normals at the point of interaction. The inclusions can be either spherical,
ellipsoidal, or highly detailed rocks reconstructed from x-ray microtomography images of concrete samples.
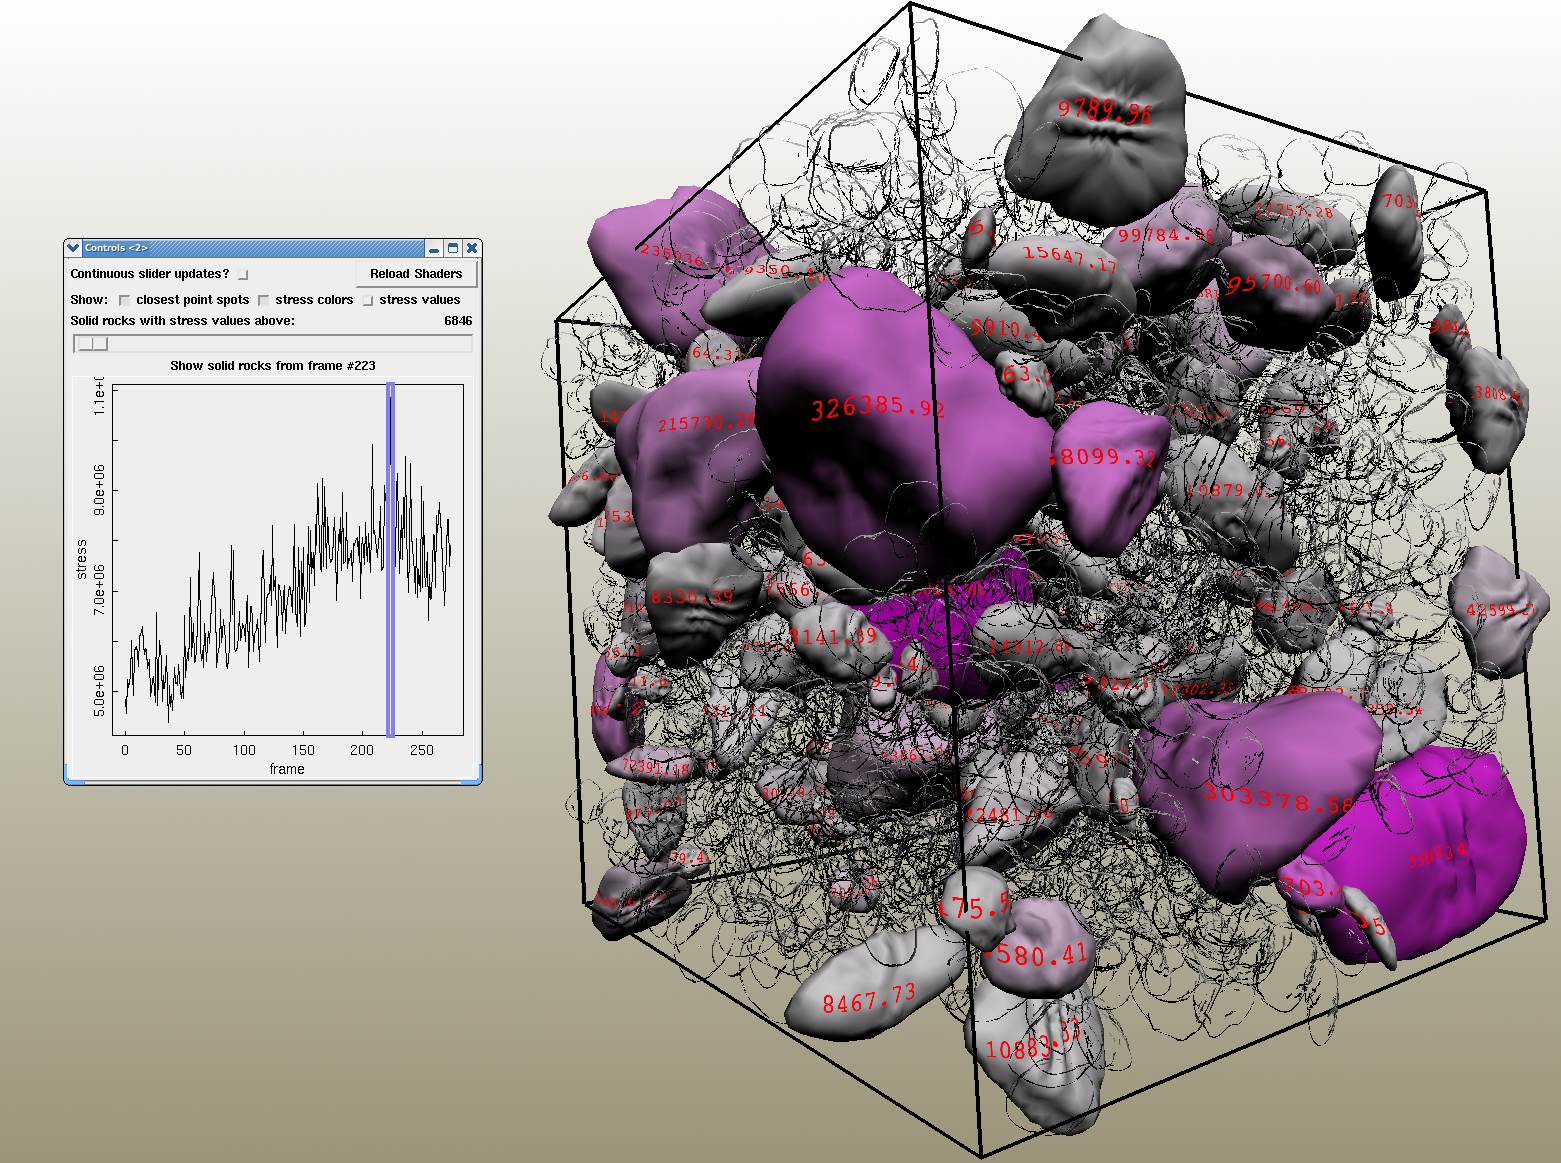
There are two types of visualizations, both of which are GPU shader-based visualizations of the cement flow simulation.
- Non Photorealistic Rendering
The "Shader" control panel gives control of several features:
 |
"key frame" -- can change to any frame in the animation. If set to -1, solid vs. outline is determined on a frame by frame bas
is rather than tracking the rocks from a single key frame through the entire simulation. |
|
spot cutoff -- stress level for drawing red spots. Values are given in the demo/shaderData.txt file. For example, if this file
includes a line saying "2: 2401.78", then a spot cutoff of 2402 would never show more than two spots on any rock in any frame of the
simulation. |
|
silhouette cutoff -- stress level for drawing solid vs. silhouette rocks |
|
stress scale -- highest stress rocks are shown darker. For a key frame with lower max stress, it may be desirable to lower thi
s to get more distinction between the rock values The rock stress values used are for the highest single point contact (not an aggrega
te stress over all contact points). |
|
stress values -- the GPU draws the stress values directly on the rocks |
 |
| Flow of Suspensions. |
 |
| Flow of Suspensions with Controls. |
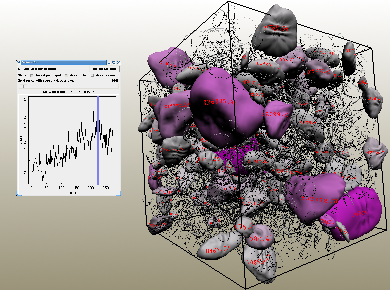
This image, shown above, won ITLs Scientific Applications and Visualization Group, Mathematical and Computational Sciences Division, o
ne of the 10 Department of Energy Office of Advanced Scientific Computing Research (OASCR) Awards at the 2008 SciDAC Conference, held
in Seattle, Washington, from July 13-17, 2008.
This visualization presented the results of a high-performance computer simulation of the flow of a particular complex suspension: con
crete. It showed a flow of a realistic collection of rocks of various sizes whose shapes were obtained by scanning actual rocks. The d
irect visualization of rocks is augmented with embedded data to provide additional information on rock-rock interactions and per-rock
stress.
Supported by the Department of Energy Office of Science, the SciDAC (Scientific Discovery through Advanced Computing) program brings t
ogether computational scientists, applied mathematicians, and computer scientists from across application domains and from universitie
s and national laboratories across the United States.
-
Real Time Volumetric Rendering via GPU Shader Programs
|
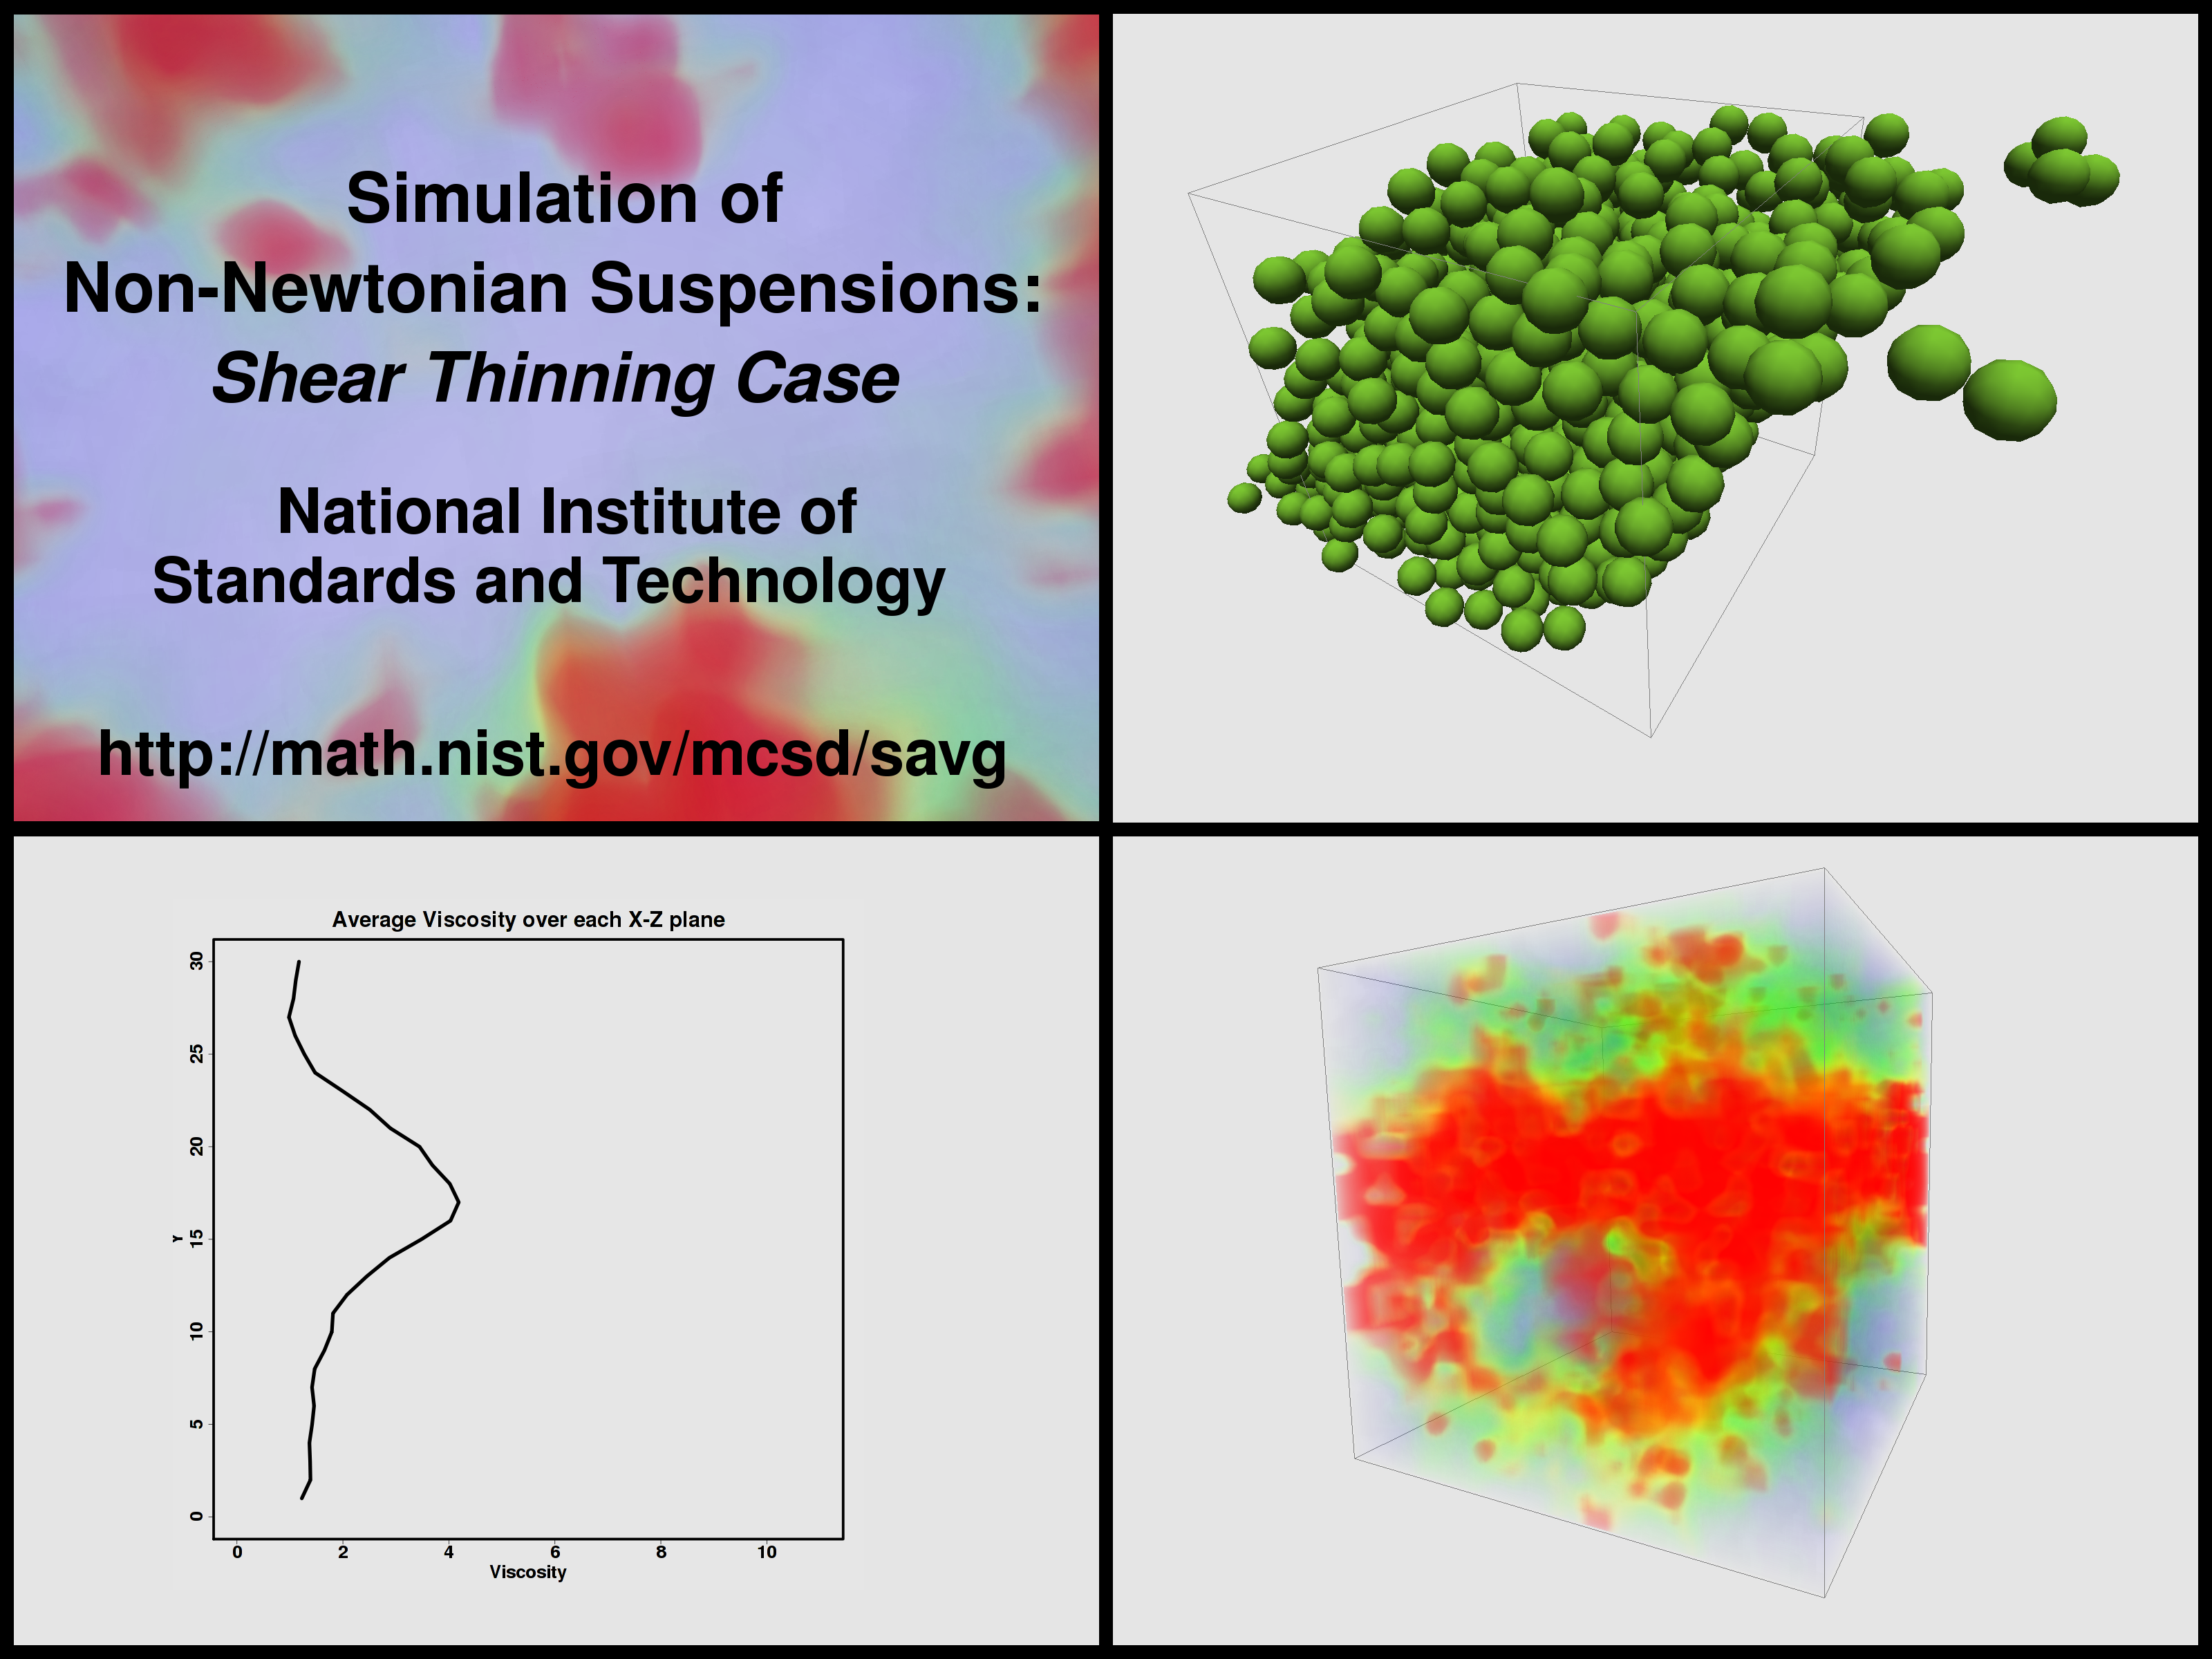
Simulation of a Non-Newtonian Suspension for the Shear Thinning Case
This technique was used to simulate a non-Newtonian Suspension for the
shear thinning case. This simulation is part of a study concerned with understanding the
rheological properties of suspensions in non-Newtonian fluid
matrices. Such suspensions are found in many products and building
materials such as paint, concrete, and mortar. In this visualization
we examine a suspension with a shear-thinning matrix fluid. That is,
the viscosity of the fluid decreases with increasing shear rate. The
visualization indicates how the local shear rates and viscosity change
throughout the suspension as a constant rate of strain is applied. It
is found that the shear rates rapidly rise near the boundary as the
strain is applied. Further, the suspension remains highly viscous in
the central portion indicating that the material away from the applied
strain does not undergo as much motion. This simple observation has
implications, for example, when one is interested in controlling how
concrete flows as one finishes the surface.
|
 |
| Non-Newtonian Fluid: Shear Thinning Case. |
|
Quicktime Movie (36 MB) |
|
AVI (75 MB)
This movie, shown above, won ITLs Scientific Applications and Visualization Group, Mathematical and Computational Sciences Division, one of the 10 Department of Energy Office of Advanced Scientific Computing Research (OASCR) Awards at the 2009 SciDAC Conference, held
in San Diego, CA, from June 14-18, 2009.
Supported by the Department of Energy Office of Science, the SciDAC (Scientific Discovery through Advanced Computing) program brings together computational scientists, applied mathematicians, and computer scientists from across application domains and from universities and national laboratories across the United States.
|
The visualization of our data plays an important role in the
validation of computer algorithms and the correctness of the physical
ideas used in modeling complex systems like suspensions.
Visualization plays an extremely important role from an educational
point of view. The images can stimulate ideas concerning new phenomena
that may be hard to deduce from the enormous data sets created during
a computer simulation. Also, visualization can help direct the
researcher in terms of what numerical tests or measures to apply to
evaluate the physical behavior of the systems. An example is the
strong ordering seen in the simulation of ellipsoids under shear at
high solid fractions. This was unexpected and led to improved ways of
quantifying such phenomena. Additionally, visualization assists in
communication of research results.
|
Papers/Presentations
|
Edward Garboczi , Jeffrey Bullard, Nicos Martys and Judith Terrill,
The Virtual Cement and Concrete Testing Laboratory: Performance Prediction, Sustainability, and the CSHub
in NRMCA Concrete Sustainability Conference , Tempe, AZ,
April 13-July 15, 2010.
|
|
Judith Terrill, W. L. George , Terrence J. Griffin , John Hagedorn, John T. Kelso, Marc Olano, Adele Peskin , S. Satterfield, James S. Sims, J. W. Bullard, Joy Dunkers, N. S. Martys , Agnes O'Gallagher and Gillian Haemer,
Extending Measurement Science to Interactive Visualization Environments
in Trends in Interactive Visualization: A-State-of-the-Art Survey,
Elena Zudilova-Seinstra, Tony Adriaansen and Robert Van Liere (Ed.)
,
Springer, U.K.,
2009.
Note: Pages: 207-302 |
|
Nicos Martys, Didier Lootens, W. L. George and Pascal Hebraud , Contact and stress anisotropies in start-up flow of colloidal suspensions,
Physical Review E, 80,
2009.
ID: 031401.
Note: Comment: Phys. Rev. E80, 031401, 7 pages, (2009) |
|
James S. Sims and Nicos S. Martys, Simulation of Sheared Suspensions with a Parallel Implementation of QDPD,
Journal of Research of the National Institute of Standards and Technology, 109
(2)
,
pp. 267-277.
Links:
pdf and postscript.
|
|
N. S. Martys , D. Lootens, W. L. George , S. Satterfield and P.Hebraud ,
Spatial-Temporal Correlations in concentrated suspensions
in 15th International Congress on Rheology, Monterey CA.,
August 3-8, 2008.
|
|
N. S. Martys , D. Lootens, W. L. George , S. Satterfield and P.Hebraud ,
Stress chains formation under shear of concentrated suspension
in 15th International Congress on Rheology, Monterey CA.,
August 3, 2009-August 8, 2008.
|
|
N. S. Martys , C. F. Ferraris , V. Gupta , J.H. Cheung , J. G. Hagedorn , A. P. Peskin and E. J. Garboczi ,
Computational Model Predictions of Suspension Rheology: Comparison to Experiment
in 12th International Conference on the Chemistry of Cement, Montreal, Canada,
July 8-13, 2007.
|
|
Nicos S. Martys and James S. Sims,
Modeling the Rheological Properties of Concrete
delivered at Virtual Cement and Concrete Testing Laboratory Meeting, Gaithersburg, MD,
June 8, 2000.
|
|
James S. Sims, William L. George, Steven G. Satterfield, Howard K. Hung, John G. Hagedorn, Peter M. Ketcham, Terence J. Griffin, Stanley A. Hagstrom, Julien C. Franiatte, Garnett W. Bryant, W. Jaskolski, Nicos S. Martys, Charles E. Bouldin, Vernon Simmons, Olivier P. Nicolas, James A. Warren, Barbara A. am Ende, John E. Koontz, B. James Filla, Vital G. Pourprix, Stefanie R. Copley, Robert B. Bohn, Adele P. Peskin, Yolanda M. Parker and Judith E. Devaney, Accelerating Scientific Discovery Through Computation
and Visualization II,
NIST Journal of Research, 107
(3)
,
May-June, 2002,
pp. 223-245.
Links:
postscript and pdf.
|
|
James S. Sims, John G. Hagedorn, Peter M. Ketcham, Steven G. Satterfield, Terence J. Griffin, William L. George, Howland A. Fowler, Barbara A. am Ende, Howard K. Hung, Robert B. Bohn, John E. Koontz, Nicos S. Martys, Charles E. Bouldin, James A. Warren, David L. Feder, Charles W. Clark, B. James Filla and Judith E. Devaney, Accelerating Scientific Discovery Through Computation
and Visualization ,
NIST Journal of Research, 105
(6)
,
November-December, 2000,
pp. 875-894.
Links:
postscript and pdf.
|
|
|
|
|
 |
| Observation of Jeffery's orbits |
We simulated a dilute suspension of 11 identical ellipsoids (axis
ratio 1:2:4) subject to shear to test our Quaternion-based
Dissipative Particle Dynamics (QDPD) algorithm. As can be seen in
the video, the ellipsoids undergo a rotational motion. This is a well
known phenomenon called Jeffery's orbits. The period of rotation was
derived by Jeffery, and our simulations were found to be consistent
with this theory, hence validating our numerical approach.
 |
| Suppression of Jeffery's orbits |
When the solid fraction (ratio of solid volume to total volume of
system) of ellipsoids was increased to about 15-20 percent, Jeffery's
orbits were suppressed. In this case, the ellipsoids have a tendency
to align. An interesting consequence of this alignment is that the
viscosity of the suspension is lower than that of an equivalent sphere
system (same number and volume of spheres). Note, in the dilute regime
(as in the previous movie) an equivalent suspension of spheres has a
lower viscosity. One way to think about it is that once the ellipsoids
align it is "easier" for them to get around each other. Hence the
viscosity decreases.
 |
| High density suspension of ellipsoids under shear |
This movie shows a dense suspension of ellipsoids similar in solid
fraction to that of the typical aggregate contribution in concrete.
Again, at this high solid fraction Jeffery's orbits are suppressed and
the alignment between ellipsoids is enhanced.
 |
| Flow around steel reinforcing bars (rebars) |
In the flow and placement of concrete, it is important that the
fluid concrete have the capability to move around barriers like
rebars. In this simulation, we show how spherical aggregates move
around stationary cylinders (z-axis is into the screen) which
represent steel rebars. We are currently carrying out a study
investigating the role of particle shape and size in the flow of
concrete around obstructions like rebars.
 |
| Model Rheometer |
This movie shows the motion of a suspension of spheres in a
coaxial geometry. The motion of the spheres is driven by the rotation
of the inner cylinder. The outer cylinder is not seen, but can be
inferred by the positions of the outer spheres. The viscosity of a
suspension is often determined in a coaxial rheometer where an inner
cylinder rotates as it is subject to an applied torque. Knowing the
torque and the subsequent rotation rate of the inner cylinder, one can
derive the viscosity of the fluid in this flow geometry. We are
currently investigating how the coupling of the inner cylinder to the
fluid suspension affects the measurement of viscosity.
 |
| Alternate View |
Ellipsoidal aggregate, in a shear flow, view from within the flow.
|
|