Despite significant damage including collapse due to fire in major buildings (e.g., First Interstate Bank Building, One Meridian Plaza, One New York Plaza, and WTC 7), current building codes in the US do not consider fire as a design condition. Rather, required fire ratings of building members and assemblies are specified in building codes.
Current prescriptive practice for assuring fire resistance ratings are based on a standard fire test that has changed little since its introduction in 1917. A new approach to fire-safe design is needed to assure the safety of building occupants and first responders, accommodate ever-changing building design practice, and allow the introduction of innovative materials and systems.
The Buildings and Fire Research Laboratory (BFRL) at NIST has undertaken a research effort to develop a unified performance-based methodology to evaluate the fire behavior of building-type structures by incorporating knowledge concerning fire load, material response, and overall structural response to elevated temperatures. Such an approach will allow an understanding of the behavior of different types of structural systems exposed to the same fire, and to evaluate the effectiveness of alternate fire protection strategies.
The analytical approach being taken involves the prediction of the growth and spread of fire (fire dynamics), the heating of structural elements (heat transfer), and calculation of the structural performance (structural analysis) for a building under the insult of an uncontrolled fire. It is this last aspect, structural performance, that involves the computation of thermally induced stresses and strains, and overall forces and deformations of the structural elements, up to the point of incipient collapse.
Structural components of a building deform under fire-induced temperatures (around 1100 °C) in two ways. First, in the case of steel, the strength and stiffness (modulus of elasticity) both decrease at temperatures above about 200 °C. Compressive strength and modulus of elasticity of concrete also diminish with increasing temperatures and high-strength concrete can spall (break into small fragments) as trapped water expands. Second, the coefficient of thermal expansion for both steel and concrete is positive resulting in thermal expansion of the structural elements under high temperatures. If this thermal expansion is restrained by, say, surrounding cooler parts of the structure, large forces in the structural elements result. It is this combination of diminishing mechanical properties and thermally induced forces that cause damage, failure and possible collapse of a building structure.
In order to numerically model the behavior of structures under fire, a sequential process was followed in which first the NIST Fire Dynamics Simulator (FDS)
program was used to simulate the start and development of fire in the room.
We output the adiabatic surface temperature at selected points from FDS over the length of the
simulation. These points serve as a boundary conditions for the structures in the second analysis.
The second computer program (thermal model) was used to calculate how the gas temperature
computed by the FDS program at the selected points propagated into the structures (beams, connectors, etc.).
Finally, a third
computer program was used to compute how the structures (beams, connectors, etc.) deformed over time
due to combined effects of thermal and mechanical loads.
The combined output of these linked simulations consists of three massive databases. Interactive visualization and visual numerical analysis are used to gain understanding of the results.
There are multiple things to visualize.
- The geometry of the building and combustibles therin.
These are specified in the FDS input file. Additionally, the nature of the materials are included there.
We have developed a program, hev-buildFDSGeom, that reads FDS input files and generates the
polygonal representation detailed in the input file. See Figure 1 below for an example.
- The points where the adiabatic surface temperture is saved for input into the second program, the thermal analysis
These are specified in the FDS input file. Our program, hev-buildFDSGeom, that reads the FDS input file,
generates representations for these points. See Figure 1 below for an example.
- The geometry and components of the structures (beams, connectors, etc.)
These are specified in the finite element input files. Polygons are generated from these.
- The fire without smoke
The Fire Dynamics Simulator computes temperature and heat release rate
per unit volume on a uniform grid at each time step. The temperature is
used to determine flame color, based on Planck's law for black body
radiation evaluated at three wavelengths, one red, one green and one
blue. The heat release rate indicates how strongly the fire is burning,
and is used to set the opacity of the flame visualization, with one
opaque band every 500 kW/m3. We developed a volume renderer that runs
on our PC's graphics hardware to visualize this volume. For each pixel,
the volume renderer steps through the volume, numerically integrating
the color and opacity. Both the color and opacity are computed on the
fly during the integration.
- The fire with smoke
To add smoke to the previous visualization, we use the Fire Dynamics
Simulator to also generate a uniform grid of soot densities at each time
step. This density is used to compute a smoke opacity. Where the smoke
is more opaque than the flame opacity, we replace the flame with a black
partially opaque smoke. The same volume renderer is used to visualize
the combined flame and smoke.
- The windows breaking and blowing out
The visualization of the windows breaking and blowing out follows a two step process. We have
developed a program, hev-brokenWindow, that creates a random fracture pattern in a window, based upon user inputs.
This program outputs the polygons that comprise the pattern. The we run our program, hev-animateWindow, which uses
the Bullet Physics Engine to determine the dynamics of the
glass shards.
- The interactive analysis
|
|
|
 |
Dilip Bannergee, John Gross, Pradeep Reddy Gaddam, Marc Olano, William Hess, Judith Terrill, Terence Griffin, John Hagedorn , John Kelso and Steve Satterfield ,
An Integrated Interactive Visualization and Analysis Environment to study the Impact of Fire on Building Structures
in SIGGRAPH 2010 , Los Angeles, CA,
July 25-29, 2010.
|
|
Dilip Bannergee, John Gross, William Hess, Marc Olano and Judith Terrill,
Visualization of Structural Behavior under Fire,
August 2009.
Available as NISTIR 7619.
|
|
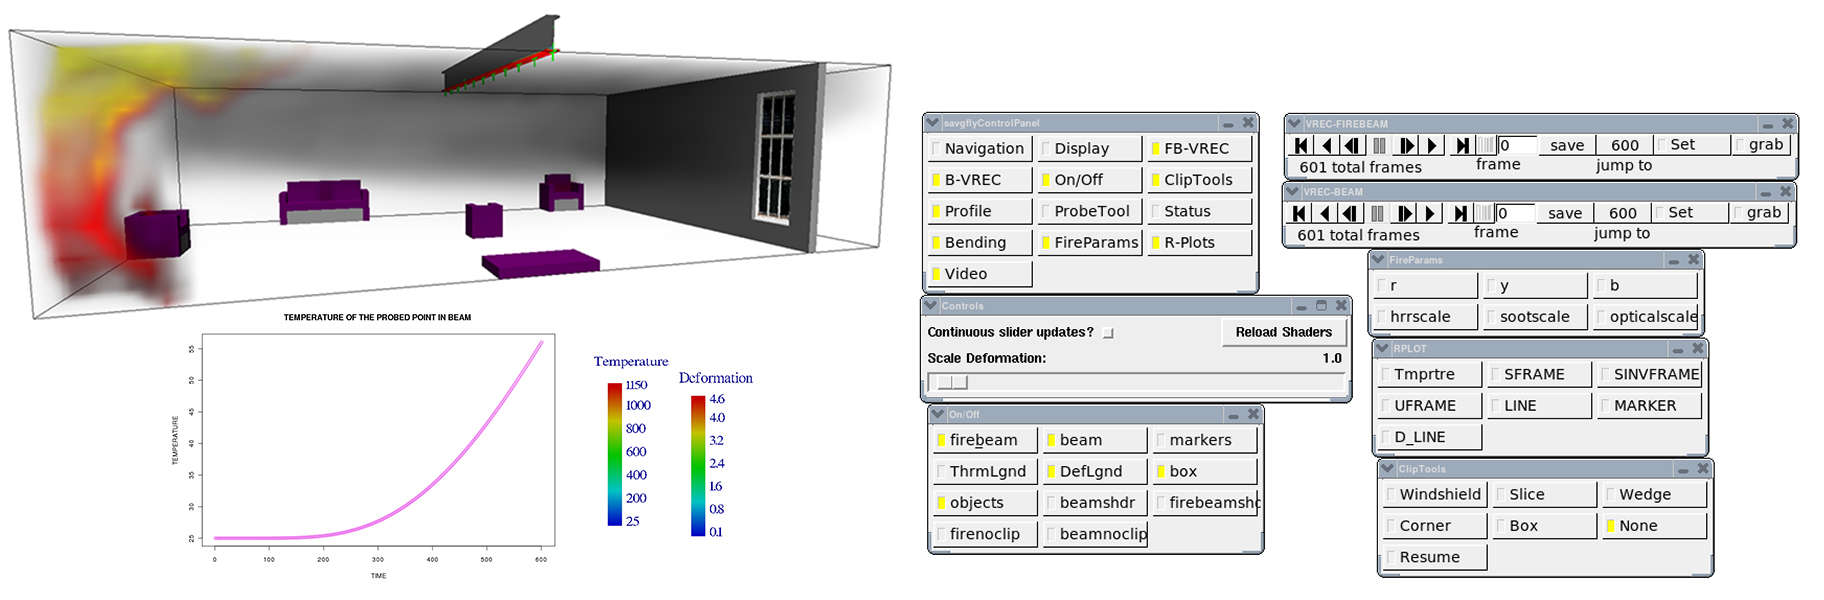 |
| Fire in a room with a single beam. the green glyphs on the beam show the data points for transfer to the thermal and structure codes from the fire code. |
|
|
|