In order to gain insight into data collected from networks and network simulations, we have developed an information visualization tool called DiVisa.
DiVisa is a multi-dimensional visualization tool developed for researchers to understand the behavior of their data. From raw data, the user can interact with the visualization in order to obtain different "points of views" and thus to extract more information from the data. Geometrical forms such as squares, ellipses or lines are associated with data and visual attributes such as position, size, shape, color, stroke are used to represent different dimensions. Indeed, the researcher can easily modify the associations between data items and visual attributes, apply mathematical functions on and between items, subset and zoom in on areas, data ranges, or times of interest, superpose curves with transparency to compare them, and animate the visualization to show time series data. Moreover, the program can read any kind of data (simulation, statistics, text or numeric, etc.), and converters have been implemented to read several data formats without need for reformatting.
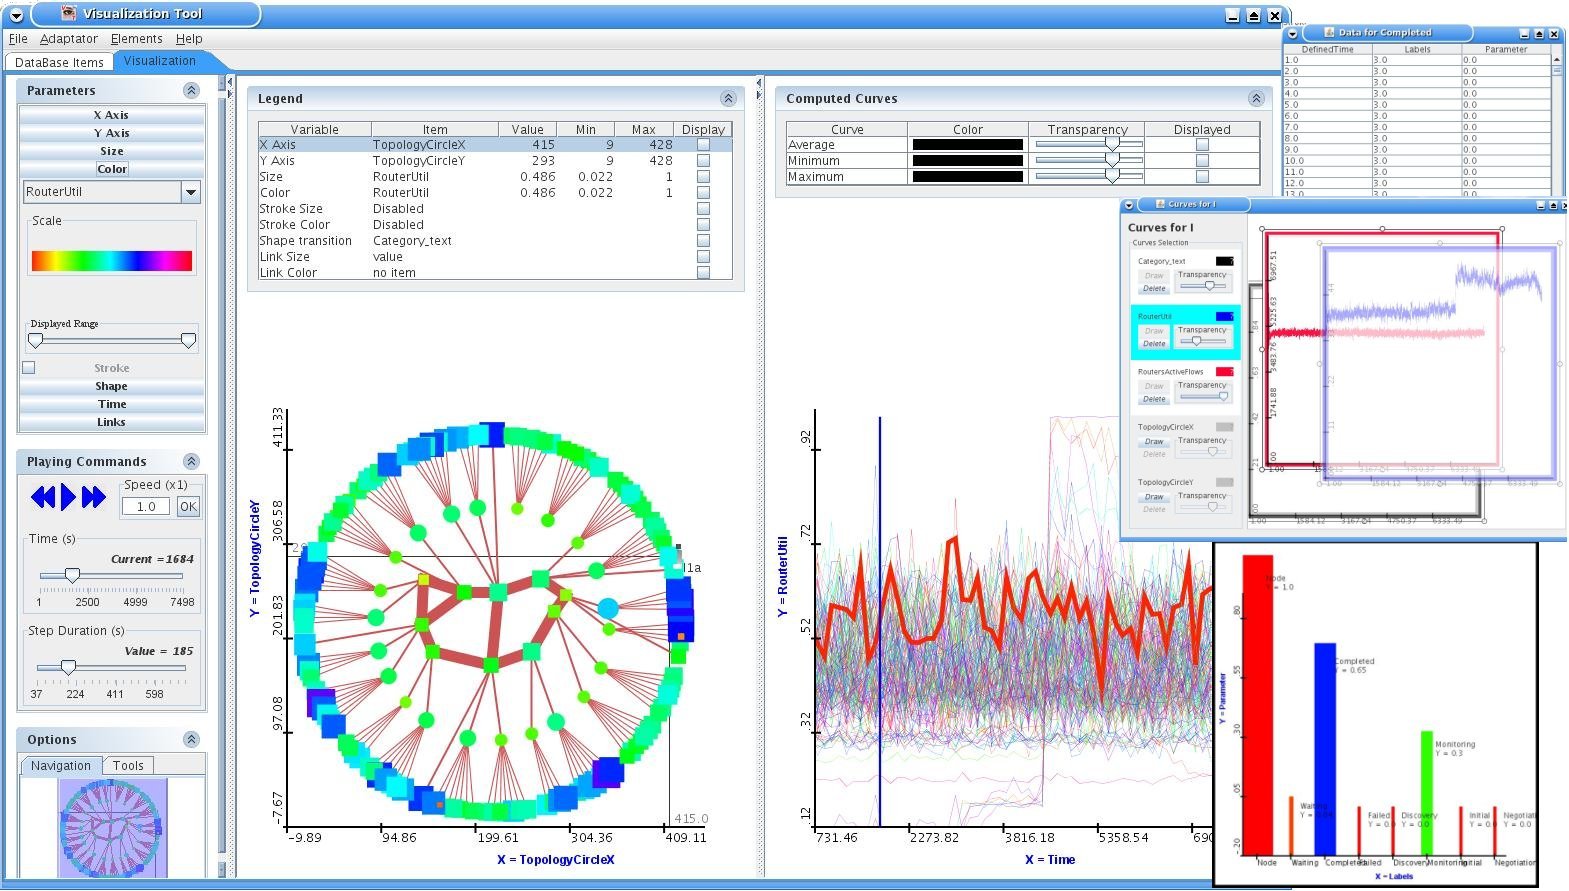 |
| Figure 1: One frame from an animated visualization of a simulation of the "Abilene" network. On the left panel, the innermost nodes are the backbone routers, the next ring represents the subnet routers, and the outermost ring shows the leaf routers. On the right panel, the time series curves of the routers (one is currently selected) are displayed. On the right side, different options available: numeric data display (top); superposed time series curves (middle); and diagram view (bottom). |
DiVisa can read ".csv" (Comma-Separated Values) files, in which the first line contains the names of the variables, and the other lines the values of the variables. For the variables values, lines can be added in any order, and values can be numerical or literal. You can add ".csv" files with the "Database Items" interface.
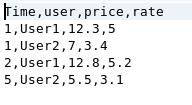 |
| Figure 2: Example of a valid ".csv" file for DiVisa. |
When one or more files are added, some variables (items) have to be selected in order to launch a visualization:
 |
Time Item: it is the item chosen to be on the "Time Axis", as the dynamic reference item. Then the visualization could be played along this axis. (It does not have to be a real time variable); |
|
Id Item: it is the item chosen as the elements of the visualization. One graphical element (such as an ellipse) will be attributed to each element. In the ".csv" example above, a good Id Item could be "user"; |
|
Visual attributes items: a visualization can be launched with only both items above, but a complete visualization need other items in order to associate visual attributes to the variables. Such an item can be associated with a visual attribute from the beginning, and then changed during the visualization. There are two types of visual attributes:
|
Regular attribute: directly associated with the elements graphical symbols (position with X and Y axe, size, color, stroke size, stroke color, shape); |
|
Link attribute: in case of linked elements (such as nodes in a network), two more visual attributes can be associated with links graphical symbols: size and color. |
|
The visualization tabulation is divided in three parts: the left main view (in the middle), the right time view (on the right), and the menu (on the left).
The Left Main View gives a view along the X and Y axe. It displays all the elements (each represented by a graphical element such as an ellipse) at a given time. Most of the visual attributes are displayed in this view, which is updated while playing.
A Legend panel is displayed on this view in order to give a summary of the associations and to display the information specific to an element while passing the mouse on.
The Right Time View gives a view along the Y and Z (Time) axe. It displays all the elements (each represented by a line) through the time (according to the time item chosen). A blue bar indicates the current time.
A Computed Curves panel is displayed on this view: the user can choose to display some computed curves. For example, the average curve displays for each time the average of the Y item values between all elements.
The associations between the items and the visual attributes are defined in the "Parameter panel" (in the menu on the left). Each visual attribute is represented and the user can select the item he wants to associate with. Stroke is unactivated by default and could be activated by checking the box next to the "Stroke" tabulation. Visual atributes of links are activated only if there is links, ie if a linked items hav been chosen in the "Database items" tabulation.
|
The Navigation Panel: it gives a small view of the entire left view. The user can also use it to navigate through the left view. |
|
The Separating Lens: when more than one elements are displayed at the same position in the left view (same X and Y), passing the separating lens on them will separate them. |
|
Bar Diagram: to display elements as diagrams (long bars instead of ellipses or squares). More useful after using the "To Diagram" converter. |
|
|
|
|