The Phase-Field method is a mathematical technique, based in
thermodynamics, for describing the process of phase transition in a
material (e.g. from a liquid to solid). One of the distinguishing
characteristics of the phase field approach is that the interface
between phases is diffuse. This is in contrast to methods which
assume a sharp interface between phases, that is, each point in the
material is either fully solid or fully liquid, with the interface
describing a moving 2-dimensional surface, complete with associated
boundary conditions. The phase-field is an order parameter
introduced to the model which holds the phase value, from 0.0 (pure
liquid) to 1.0 (pure solid), for each point in the volume of material.
Although the phase-field does not necessarily correspond directly to
some physical material parameter (although it can), the introduction
to the model of this order parameter is a useful mathematical
technique commonly used in material science. The phase field method
reduces to the sharp interface picture of a phase transition in the
limit where the interface thickness goes to zero.
One advantage gained by using the phase-field method to model phase
transitions, compared to the more commonly used sharp-interface
method, is that the explicit tracking of the moving surface, the
liquid and solid interface, is completely avoided. Instead, the phase
of each point in the simulated volume is computed at each time step.
The liquid-solid interface can be determined, and viewed, after the
computation completes by post-calculating isosurfaces of constant
phase field (say at a value of 1/2). In addition, the phase field
method incorporates many types of physical phenomena without ad hoc
introduction.
The Phase Field Method has been parallelized.
 |
Why Parallelize the Phase Field Method?
In contrast to the sharp-interface method, the phase-field method
updates the state of every point in the simulated volume on each
iteration. This requires the use of full 3-dimensional arrays to hold
the phase field as well as other modeled parameters. This results in a
large memory requirement for a phase-field method based simulator.
For full resolution 3-dimensional simulations, the size of the
computational grid over which these phase-field simulations are run
can require a large amount of memory, 50 GB to 100 GB, as well as a
large number of floating point computations per time step. Single
processor computers and small SMPs with 16 to 32 processors simply do
not contain enough main memory to hold these computations, so a
parallel version is necessary. It is this large memory requirement
that has, until recently, prevented the regular use of the phase-field
method. Now that large parallel machines and clusters have become
commonly available this method has become feasible.
|
|
How is the Parallelization Realized?
The simulator we have developed, which uses the phase-field method for
modeling the solidification of an alloy, is implemented as a portable
parallel C program using MPI (Message Passing Interface) for
interprocessor communication.
The 3-dimensional arrays used in this simulator are distributed over
the available processors such that each processor can complete one
iteration of the simulation in approximately the same amount of time
as the other processors. In the simplest case, if all processors are
equally powerful and equally loaded, the array elements can be
distributed evenly among the processors. Our implementation
distributes the arrays in blocks along one axis although two or three
dimensional distributions are possible. At the end of each iteration,
processors holding adjacent array elements exchange those elements for
use in the computation of the following iteration.
The load balance between the processors is monitored within the
application and the distribution of the arrays is adjusted, between
iterations, whenever a significant imbalance is detected. Both the
frequency of these load balancing operations and the threshold of what
is considered a "significant" load imbalance is easily configured by
the user.
The distribution and load balancing of the arrays as well as the
exchanging of neighboring array elements is managed by the routines in
the utility library
DParLib,
an MPI (Message Passing Interface) based
library for simplifying the coding of data-parallel style programs.
|
|
What is the Performance of the Parallel Code?
Our dendritic growth simulator, bin3d, has been run on all of our local
parallel machines and exhibits excellent performance and scales well as
we increase the number of processors used for a given simulation size.
The simulation updates each point in a uniform 3-dimensional grid
of points using a simple finite-difference approximation
to the partial differential equations that describe the system.
The bin3d simulator uses 8 3-dimensional arrays of
size (nxnxn), each holding
double precision floating point values. A near term goal is to
perform simulations on grids of size 1000x1000x1000.
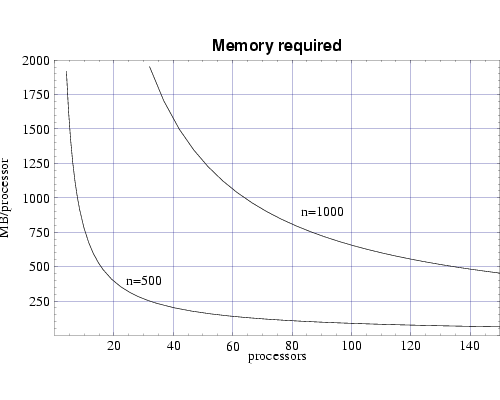
Figure 1 shows the resulting per-processor memory requirement
as a function the number of processors used for n=500 and
n=1000.
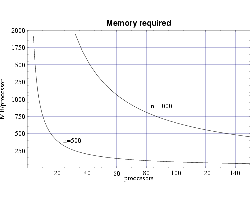 |
| Fig 1: Memory requirement per node for bin3d. |
An analysis of the bin3d algorithm shows that the expected run time
for this simulator is  .
where the computational grid is of size .
where the computational grid is of size
 .
This reflects the fact that each grid point is updated on each time
step of the simulation, for an order
computation on each iteration,
and the number of iterations required for the liquid-solid interface
to reach the edge of the volume increases linearly with .
This reflects the fact that each grid point is updated on each time
step of the simulation, for an order
computation on each iteration,
and the number of iterations required for the liquid-solid interface
to reach the edge of the volume increases linearly with
 .
Assuming a perfect speedup with the number of processors, this
expected execution time .
Assuming a perfect speedup with the number of processors, this
expected execution time
 can be modeled with the equation:
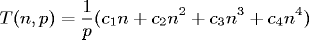
where
is the number of computational grid points along each of the
three axes, and
 is the number of processors used.
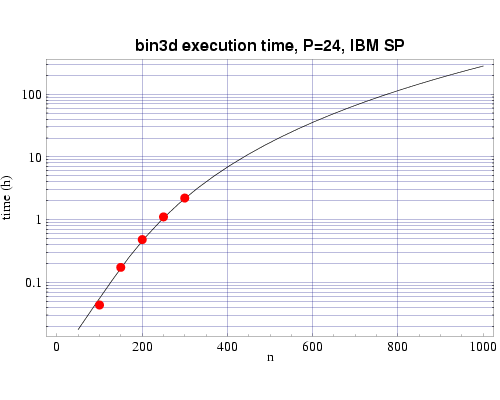
Using several sets of test runs on our local machines, including
an IBM SP with 200 MHz POWER3 processors, and a Beowulf cluster of 333 MHz
Pentium II processors, we have plotted actual execution times
against a curve fitted to our expected performance model
 . .
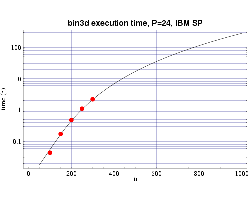 |
| Fig 2: Execution time on 24 200 MHz POWER 3 processors. The plotted
points are actual times and the curve fitted to the T(n,p) function.
|
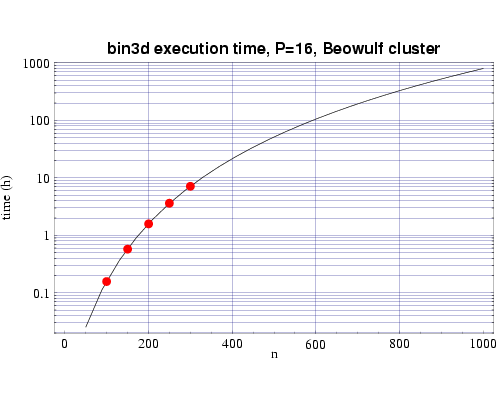
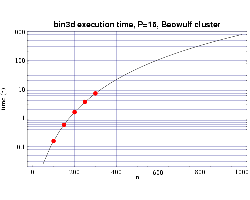 |
| Fig 3: Execution time on 16 333 MHz Pentium III processors.
The plotted points are actual times and the curve fitted to
the T(n,p) function.
|
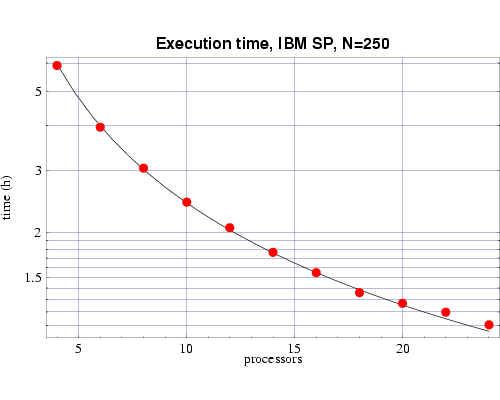
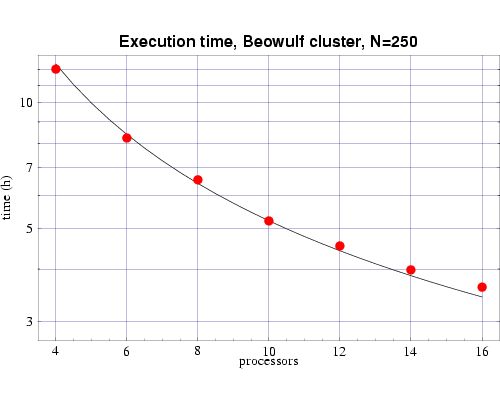
Using the T(n,p) functions determined from Figs. 2 and 3, we next
show the results from a series of timing tests for a fixed problem
size of n=250 and a varying number of processors.
These results are plotted along with the prediction from the corresponding
T(n,p) function we previously determined.
These results, which show good agreement with the predicted
values, are shown in Figs. 4 and 5. Some error begins to occur
as the ratio of n/p begins to get too small and the
communication overhead begins to become significant compared
to the computational load on each processor.
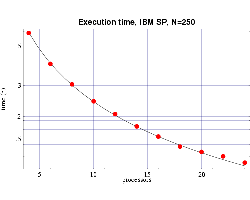 |
| Fig 4: Execution time, on 200 MHz IBM POWER 3 processors,
for bin3d with n=250.
The plotted points are actual times and the curve is the function
T(n,p) from Fig. 2.
|
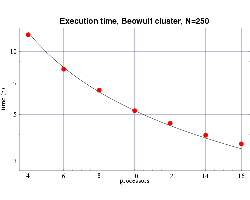 |
| Fig 5: Execution time, on 333 MHz Pentium III processors,
for bin3d with n=250.
The plotted points are actual times and the curve is the function
T(n,p) from Fig. 3.
|
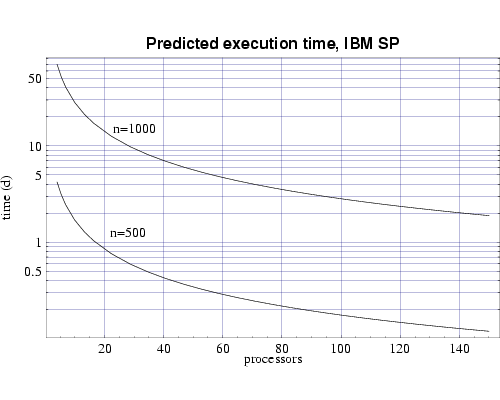
Finally, we use the T(n,p) functions to predict the execution time
for our target problem of n=1000 on both the IBM SP and on the
Beowulf cluster of PCs. Assuming each processor has 1 GiB of main
memory, and from the memory requirement plot in Fig. 1 we see that we
need to use at least 70 processors to perform our full sized
simulation. Figures 6 and 7 shows that this simulation, using
70 processors, would require
approximately 4 days to complete on the IBM SP and approximately 10
days on the PC cluster. Of course these times will be be reduced as
we upgrade the processing nodes in our parallel machines to more
current technology and also if we simply use more processors.
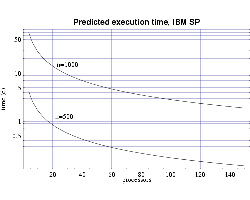 |
| Fig 6: Predicted execution time for bin3d
on 200 MHz IBM POWER 3 processors for problems of size n=500
and n=1000.
|
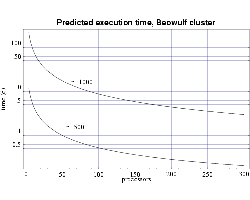 |
| Fig 7: Predicted execution time for bin3d
on 333 MHz Pentium III processors for problems of size n=500
and n=1000.
|
|
|
|
|
|
Modeling Dendritic Growth in Metallic Alloys
|
|
Papers/Presentations
|
William L. George and James A. Warren, A Parallel 3D Dendritic Growth Simulator Using the Phase-field Method,
Journal of Computational Physics, 177,
2002,
pp. 264-283.
Links:
postscript and pdf.
|
|
James S. Sims, William L. George, Steven G. Satterfield, Howard K. Hung, John G. Hagedorn, Peter M. Ketcham, Terence J. Griffin, Stanley A. Hagstrom, Julien C. Franiatte, Garnett W. Bryant, W. Jaskolski, Nicos S. Martys, Charles E. Bouldin, Vernon Simmons, Olivier P. Nicolas, James A. Warren, Barbara A. am Ende, John E. Koontz, B. James Filla, Vital G. Pourprix, Stefanie R. Copley, Robert B. Bohn, Adele P. Peskin, Yolanda M. Parker and Judith E. Devaney, Accelerating Scientific Discovery Through Computation
and Visualization II,
NIST Journal of Research, 107
(3)
,
May-June, 2002,
pp. 223-245.
Links:
postscript and [old link] http://nvl.nist.gov/pub/nistpubs/jres/107/3/cnt107-3.htm pdf.
|
|
James S. Sims, John G. Hagedorn, Peter M. Ketcham, Steven G. Satterfield, Terence J. Griffin, William L. George, Howland A. Fowler, Barbara A. am Ende, Howard K. Hung, Robert B. Bohn, John E. Koontz, Nicos S. Martys, Charles E. Bouldin, James A. Warren, David L. Feder, Charles W. Clark, B. James Filla and Judith E. Devaney, Accelerating Scientific Discovery Through Computation
and Visualization,
NIST Journal of Research, 105
(6)
,
November-December, 2000,
pp. 875-894.
Links:
postscript and [old link] http://nvl.nist.gov/pub/nistpubs/jres/105/6/cnt105-6.htm pdf.
|
|
|
|