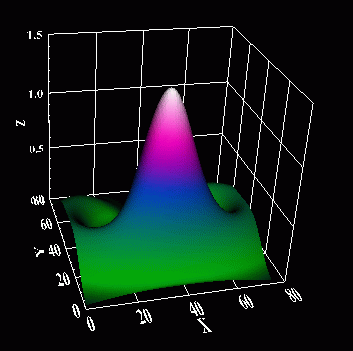
 (
( (2) adding a title to the axes,
(3) using a custom made function for drafting gridelines to enclose the surface plot,
(4) moving the z axis to the rear of the plot (away from the origin) and
(5) using a different
color table.
 ( ( |
This image was created using the same using the same code as
Example 3, with a few changes. 1) Changing
the font and font size on the axis values,
(2) adding a title to the axes, (3) using a custom made function for drafting gridelines to enclose the surface plot, (4) moving the z axis to the rear of the plot (away from the origin) and (5) using a different color table. |
; This function takes a range vector [min, max]
as contained
; in the [XYZ]RANGE property of an object and
converts it to
; a scaling vector (suitable for the [XYZ]COORD_CONV
property)
; that scales the object to fit in the range
[0,1].
scale = [-range[0]/(range[1]-range[0]), 1/(range[1]-range[0])]
RETURN, scale
END
;**************************************************************
Pro poly3
; Define the number of elements in the x and y
directions of the
; data array. This will be the size of
the array after the array has
; been decimated for reducing the size of the
.wrl file.
; For the procedure rebin, used below, to work
the value used for
; array_elems must be derived by integer division
of the original
; array size.
array_elems = 100
file1 = 'image'
;read,'enter filename: ',file1
openr,1,file1
i1 = 1
i2 = 1
i3 = 1
i4 = 1
i5 = 1
i6 = 1
r1 = 1.0
r2 = 1.0
r3 = 1.0
r4 = 1.0
readf,1,i1,i2,i3
data = fltarr(i1,i2,i3)
for j = 0,i1 -1 do begin
for k = 0,i2 -1 do begin
readf,1,i4,i5,r1,r2
data(j,k,0) = r1
data(j,k,1) = r2
endfor
endfor
close,1
dat0 = data(*,*,0)
dat1 = data(*,*,1)
test0 = rebin(dat0, array_elems, array_elems)
test1 = rebin(dat1, array_elems, array_elems)
;**************************************************************
; Create objects to be saved as vrml, .wrl file
myvrml = OBJ_NEW('IDLgrVRML')
myview = OBJ_NEW('IDLgrView', color=0); black for background
mymodel = OBJ_NEW('IDLgrModel')
;-------------------------------------------------------------
; Create palette and texture image to be used
on the surface
mypalette=OBJ_NEW('IDLgrPalette')
mypalette->LOADCT, 10
mytextureimage=OBJ_NEW('IDLgrImage',BYTSCL(test0), PALETTE=mypalette)
; Create the surface object and apply texture
image just created.
mysurface = OBJ_NEW('IDLgrSurface', test0, Style=2, $
texture_map=mytextureimage)
mysurface->GetProperty, XRANGE = xr, YRANGE = yr, ZRANGE = zr
mysurface->SetProperty, XCOORD_CONV = NORM_COORD(xr), $
YCOORD_CONV = NORM_COORD(yr), ZCOORD_CONV = NORM_COORD(zr)
;-------------------------------------------------------------
; Create a font object that contains the font
and font size to
; be used for text in other objects
myfont = OBJ_NEW('IDLgrFont', 'Times*bold', Size=24)
; Create the text objects that label the axes
with titles
xtitle = OBJ_NEW('IDLgrText', 'X', font = myfont)
ytitle = OBJ_NEW('IDLgrText', 'Y', font = myfont)
ztitle = OBJ_NEW('IDLgrText', 'Z', font = myfont)
;-------------------------------------------------------------
; Determine the location of the z axis for plotting.
Note, it
; will be plotted slightly beyond the end of
the array. Since
; the array will go from 0 to array_elements-1,
this correction
; is necessary
; Create the object axes. Note, 0 always
defines the x axis,
; 1 the y axis, and 2 the z axis.
xaxis = OBJ_NEW('IDLgrAxis', 0, COLOR=[255,255,255], RANGE=xr,
$
XCOORD_CONV = NORM_COORD(xr))
yaxis = OBJ_NEW('IDLgrAxis', 1, COLOR=[255,255,255], RANGE=yr,
$
YCOORD_CONV = NORM_COORD(yr))
zaxis = OBJ_NEW('IDLgrAxis', 2, COLOR=[255,255,255], RANGE=zr,
$
ZCOORD_CONV = NORM_COORD(zr))
; Set several properties associated with the axes.
xaxis->SetProperty, TICKLEN=0.02, TITLE=xtitle
yaxis->SetProperty, TICKLEN=0.02, TITLE=ytitle
zaxis->SetProperty, TICKLEN=0.02, TITLE=ztitle
; Get the property known as Ticktext and assign
it to the
; variable (x,y,z)AxisText
xAxis->GetProperty, Ticktext=xAxisText
yAxis->GetProperty, Ticktext=yAxisText
zAxis->GetProperty, Ticktext=zAxisText
; Assign the property of myfont to the *(x,y,z)AxisText.
; The same font used for the axis title is not
needed.
; A different font object could be created and
used.
xAxisText->SetProperty, FONT=myfont
yAxisText->SetProperty, FONT=myfont
zAxisText->SetProperty, FONT=myfont
;-------------------------------------------------------------
; Get properties and then call the gridlines
procedure.
; Get axis properties to pass to gridline function.
The axis
; properties will insure that the gridlines match
up with the
; major tickmarks on the axes.
xaxis->GetProperty, major = numxlines, tickvalues = xlineloc
yaxis->GetProperty, major = numylines, tickvalues = ylineloc
zaxis->GetProperty, major = numzlines, tickvalues = zlineloc
; max((x,y,z)lineloc) is used to determine how
far the gridlines
; will be plotted.
xstop = max(xlineloc)
ystop = max(ylineloc)
zstop = max(zlineloc)
; The z axis location is moved away from the origin.
zlocation = (ystop+1)/array_elems
zaxis->SetProperty, LOCATION=[0,zlocation,0]
; Call the procedure gridlines to create the polyline
graphic
; atoms and to add them to the object mymodel.
gridlines, xr, yr, zr, xstop, ystop, zstop, $
numxlines, numylines, numzlines, $
xlineloc, ylineloc, zlineloc, mymodel
;-------------------------------------------------------------
mymodel->Add, mysurface
mymodel->Add, xaxis
mymodel->Add, yaxis
mymodel->Add, zaxis
; By default the view is looking down the z axis.
This line
; changes the view to looking up the y axis.
mymodel->Rotate,[1,0,0], -90
myview->Add, mymodel
myvrml->SetProperty, filename='poly3.wrl'
; SET_VIEW is a general purpose procedure which
calculates a
; reasonable viewplane rectangle
SET_VIEW, myview, myvrml
myvrml->Draw, myview
obj_destroy,myvrml
end
??