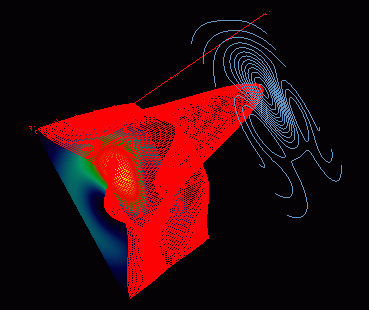
This example uses the same code as in Examples 2 and 3. The image of Example 2 is plotted first, but it has a minor different syntax for specifying the data to be used. The way shown in Example 2 will not work when combined with the surface and contours. Also, note that the technique to thin the array with the function "rebin" was necessary. Without it, the wire mesh surface was so dense with 9X as many lines, that it was almost solid.
Research Systems, Inc. created a nifty version of this example, they call Show3. It does not produce a VRML file, but does create a series of widgets that help the manipulation of the objects. The only drawback of this example is that it requires a view to be in the IDL environment to use the program.
Click on the image to view the actual VRML file:

; This function takes a range vector [min, max] as contained
; in the [XYZ]RANGE property of an object and converts it to
; a scaling vector (suitable for the [XYZ]COORD_CONV property)
; that scales the object to fit in the range [0,1].
scale = [-range[0]/(range[1]-range[0]), 1/(range[1]-range[0])]
RETURN, scale
END
;--------------------------------------------------------------
;--------------------------------------------------------------
Pro four
file1 = 'image'
;read,'enter filename: ',file1
openr,1,file1
i1 = 1
i2 = 1
i3 = 1
i4 = 1
i5 = 1
i6 = 1
r1 = 1.0
r2 = 1.0
r3 = 1.0
r4 = 1.0
readf,1,i1,i2,i3
data = fltarr(i1,i2,i3)
for j = 0,i1 -1 do begin
for k = 0,i2 -1 do begin
readf,1,i4,i5,r1,r2
data(j,k,0) = r1
data(j,k,1) = r2
endfor
endfor
close,1
dat0 = data(*,*,0)
dat1 = data(*,*,1)
test0 = rebin(dat0, 100, 100)
test1 = rebin(dat1, 100, 100)
;----------------------------------------------------------------------------
; Create object to be saved as vrml, .wrl file
;^^^^^^^^^^^^^^^^^^^^^^^^^^^^^^^^^^^^^^^^^^^^^^^^^^^^^^^^^^
mysurface = OBJ_NEW('IDLgrSurface', test0, Style=1, $
texture_map=mytextureimage, color=[255,0,0])
mysurface->GetProperty, XRANGE = xr, YRANGE = yr, ZRANGE = zr
mysurface->SetProperty, XCOORD_CONV = NORM_COORD(xr), $
YCOORD_CONV = NORM_COORD(yr), ZCOORD_CONV = NORM_COORD(zr)
;^^^^^^^^^^^^^^^^^^^^^^^^^^^^^^^^^^^^^^^^^^^^^^^^^^^^^^^^^^
mycontour = OBJ_NEW('IDLgrContour', test0, COLOR=[100,150,200],
$
/PLANAR, GEOMZ=1.0, C_VALUE=0, N_LEVELS=15)
mycontour->GetProperty, XRANGE = xr, YRANGE = yr
mycontour->SetProperty, XCOORD_CONV = NORM_COORD(xr), $
YCOORD_CONV = NORM_COORD(yr)
;^^^^^^^^^^^^^^^^^^^^^^^^^^^^^^^^^^^^^^^^^^^^^^^^^^^^^^^^^^
mypalette=OBJ_NEW('IDLgrPalette')
mypalette->LOADCT, 4
myimage = OBJ_NEW('IDLgrImage', DATA= BYTSCL(test0), interleave=0,
$
palette=mypalette)
myimage->GetProperty, XRANGE = xr, YRANGE = yr
myimage->SetProperty, XCOORD_CONV = NORM_COORD(xr), $
YCOORD_CONV = NORM_COORD(yr)
;^^^^^^^^^^^^^^^^^^^^^^^^^^^^^^^^^^^^^^^^^^^^^^^^^^^^^^^^^^
xaxis = OBJ_NEW('IDLgrAxis', 0, COLOR=[255,0,0], RANGE=xr, $
XCOORD_CONV = NORM_COORD(xr))
yaxis = OBJ_NEW('IDLgrAxis', 1, COLOR=[255,0,0], RANGE=yr, $
YCOORD_CONV = NORM_COORD(yr))
zaxis = OBJ_NEW('IDLgrAxis', 2, COLOR=[255,0,0], RANGE=zr, $
ZCOORD_CONV = NORM_COORD(zr))
xaxis->SetProperty, TICKLEN=0.02
yaxis->SetProperty, TICKLEN=0.02
zaxis->SetProperty, TICKLEN=0.02
;^^^^^^^^^^^^^^^^^^^^^^^^^^^^^^^^^^^^^^^^^^^^^^^^^^^^^^^^^^
myvrml = OBJ_NEW('IDLgrVRML')
myview = OBJ_NEW('IDLgrView', color=0)
mymodel = OBJ_NEW('IDLgrModel')
mymodel->Add, mysurface
mymodel->Add, mycontour
mymodel->Add, myimage
mymodel->Add, xaxis
mymodel->Add, yaxis
mymodel->Add, zaxis
myview->Add, mymodel
myvrml->SetProperty, filename='vrml_show3.wrl'
SET_VIEW, myview, myvrml
myvrml->Draw, myview
obj_destroy,myvrml
end