Graph and axis titles can be added in 2 ways. These examples should make it easy to understand:
Plot, xvalues, yvalues, $
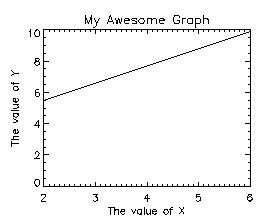
XTitle='The value of X', $
YTitle='The value of Y', $
Title='My Awesome Graph'
Here, all modifcations to the plot are made on the same command line
as the call to produce the graph. Because a command line has the
potential for getting lengthy (e.g, specifying plotting symbols, character
sizes, axis ranges, etc.), the line should be broken up by using the $
key. Don't forget to put a comma after the last item specified on
a line and before the $. However, on the last line don't put a comma
or a $.
The syntax below uses system variables and has the advantage of using separate lines instead many keywords that require multiple commas and $s. It is somewhat more difficult because you have to learn different syntax. For each item allowed to be used in this fashion, it will start with either a !g, !p, !x, !y or !z. Important: these specifications must be made prior to calling the plot command. If you place them afterward, the titles won't be displayed. This is different than XYOuts which does go after the plot command.
!x.title='The Value of X'
!y.title='The Value of Y'
!p.title='My Awesome Graph'
Plot, xvalues, yvalues