XT = DblArr(1000)
YT = DblArr(1000)
XMIN = -3.0
XMAX = 3.0
YMIN = -3.0
YMAX = 3.0
M = 40
N = 40
W = DblArr(M,N)
OpenR, lun, 'NPOINT', /Get_Lun
Point_Lun, lun, 0
ReadF, lun, npt
npoint = FIX(npt)
Free_Lun, lun
OpenR, lun, 'TRAJ', /Get_Lun
Point_Lun, lun, 0
array = DblArr(2, npoint)
ReadF, lun, array
XT = array(0,*)
YT = array(1,*)
Free_Lun, lun
FOR j=0,(N-1) DO BEGIN
Y=(YMAX-YMIN)*(FLOAT(j)/FLOAT(N-1))+YMIN
FOR i=0,(M-1) DO BEGIN
X = 5. * i/(M-1) - 0.5
X=(XMAX-XMIN)*(FLOAT(i)/FLOAT(M-1))+XMIN
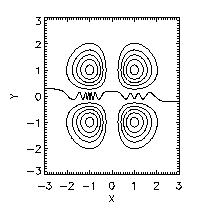
W[i,j] = (X*Y)^2*EXP(-(X^2+Y^2))
ENDFOR
ENDFOR
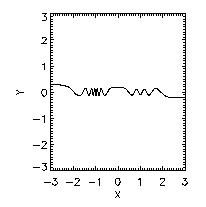
Plot, XT, YT, XTITLE = 'X', YTITLE = 'Y', $
XSTYLE = 1, XRANGE = [XMIN,YMAX],
$
YSTYLE = 1, YRANGE = [YMIN,YMAX]
END
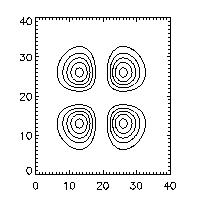
Contour, W, NLevels = 5
Note: the X and Y axes are integers from 0 to 39 which constitute
the subscripts for the two dimensions of the array.
*You must use "noerase" instead of "overplot." Overplot is confused
because you're going from 2D to 3D
Plot, XT, YT, XTITLE = 'X', YTITLE = 'Y', $
XSTYLE = 1, XRANGE = [XMIN,YMAX],
$
YSTYLE = 1, YRANGE = [YMIN,YMAX]
xax = FIndGen(40) * (6./39) - 3
yax = FIndGen(40) * (6./39) -3
Contour, W, xax, yax, XStyle=1,YStyle=1, $
NLevels = 5, /noerase