Plotting Symbols

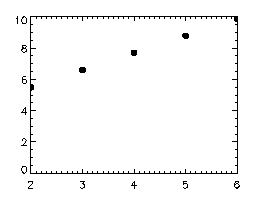
IDL contains a number of symbols ready for your use.  The symbols are designated using keywords with the Plot command such as:

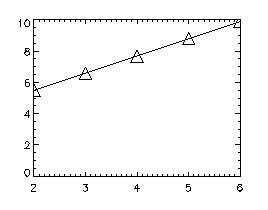
Plot, xvalues, yvalues, PSym=-5, SymSize=2.0


SymSize=2 makes the symbols twice as big as "normal."

This command draws a graph with xvalues on the x axis, yvalues on the y axis, and the points are indicated by a triangle.  The negative sign before the 5 indicates that the triangles are connected by lines.  Here is a table of predesigned symbols:
 

Index Number
Symbol Drawn on Plot
0
No symbol is used and points are connected by lines
1
Plus sign
2
Asterisk
3
Period
4
Diamond
5
Triangle
6
Square
7
X
8
User defined (with the UserSym procedure)
9
This index is not used for anything!
10
Data is plotted in histogram mode
-Psym
Negative values of PSym connect symbols with lines
You may have noticed something odd in this table--there is no symbol for a circle.  Here's how to draw a circle for your plotting symbol:

A = FIndGen(16) * (!PI*2/16.)
UserSym, cos(A), sin(A), /fill
Plot, xvalues, yvalues, PSym = 8
 
Note:  The manual gives the above code for drawing circles.  It works fine for filled circles, but for open circles, there is a small gap in the symbol. The following seems to work better for unfilled circles:

A = FIndGen(16) * (!PI*2/16.)
UserSym, cos(A), sin(A)
 

FIndGen() is a way to populate an array with its subscripts,
ie. Q =FIndGen(4) makes Q = [0, 1, 2, 3]
 UserSym manipulates the array created for a symbol to define a shape.  Then, when plotting, just specify you want your user defined symbol with PSym.  Note that the way to change an open symbol to a filled symbol is by adding , /fill on your command line.