ITLACMDScientific Applications  Visualization Group
Scientific Visualization
Attractive Image NIST
 
Up Visualization Parallel Computing Data Mining Released Software

Dielectric Breakdown


High-voltage transformers contain oil as their insulating dielectric. When a critical electric field is exceeded, conduction paths grow at microsecond speeds through the oil, in the form of branched trees, called streamers. These can lead to destructive breakdown.


The intense ionization occurring at the branch tips is high-speed and sub-microscopic in size, so that it connot be observed directly. Overall shape, growth pattern, and timing of the streamer trees can be recorded. We simulate these features by a detailed probability model, which provides three-dimensional graphical output suitable for comparison against high-speed shadow photographs obtained in experiment.


The multifractal, self-avoiding character of the streamer trees is easily seen in visualizations. The adequacy of the growth rules and size scaling are tested by comparing the visualizations against experimental data that is also visual.


Display is carried out in 3-D. Timing of the growth is shown by color banding and by frame-animation of the results.


(bullet) Parallel Algorithms and Implementation: Howland A. Fowler and John G. Hagedorn and Judith E. Terrill and Francis Sullivan
(bullet) Visualization: Howland A. Fowler and John G. Hagedorn and Judith E. Terrill
(bullet) Group Leader: Judith E. Terrill


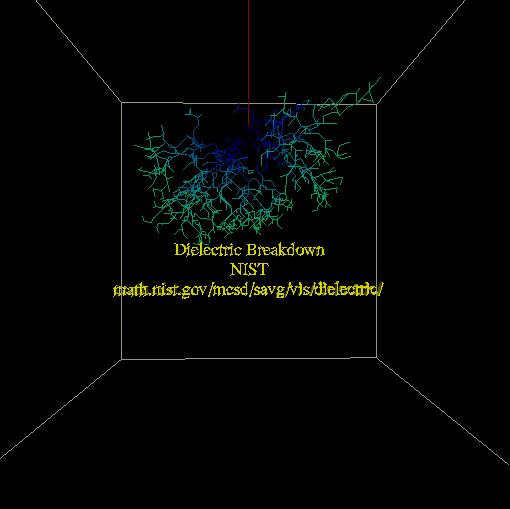
Figure 1: 4th-power-law example.

Figure 1: Attached central needle has length fifteen grid steps. The threshold (cutoff) voltage is set at 0.0700, just slightly below the largest voltage on a neighbor site to the needle. 20089 (est.) statistical tries have produced 956 discharged links. Growth across the second half of the point-to plane gap occurs in about 1/16 of the entire ``Monte Carlo" elapsed time. This speedup is a result of the low, screened initial field near the originating electrode, and the high power law assumed in the model.

Figure 2: 2nd-power-law example.

Figure 2: Square-law streamer simulation. 314 statistical tries have given rise to 1832 discharged links. The needle has been lengthened to 47 grid intervals, which more closely simulates the ``point-to-plane" configuration. Threshold (cutoff) voltage level is set at 0.2000, just slightly below the largest neighbor voltage adjacent to the needle tip.

Figure 3: linear-power-law example.

Figure 3: Linear response law. Growth is dense. 91 statistical tries have produced 27,837 discharged links. The front of the growth, facing the counterelectrode, has become rounded and brush-like; this rounding counteracts the field enhancement from the diminished gap distance, so that forward growth proceeds at a nearly constant rate. The upper envelope of growth is a flat cone, almost level with the tip of the needle.

Figure 4: Immersive visualization simulation.

Figure 4: Immersive visualization demo. This demo is in OpenGL Performer binary format. It may be viewed with perfly from SGI, or with diversifly which is part of the DIVERSE package from Virginia Tech.

(bullet) pfb file (87.8 Mb)

Figure 5: Movie of growth of a streamer tree in a breakdown process. Mpeg (1.6 MB)


Privacy Policy | Disclaimer | FOIA
NIST is an agency of the U.S. Commerce Department.
Date created: 2002-02-19, Last updated: 2011-01-12.
Contact