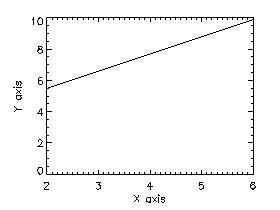
If you have a graph plotted with all the features you want, such as:
Plot, xvalues, yvalues, $
XTitle = 'X axis',
YTitle = 'Y axis'
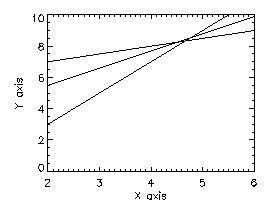
The 1st two plots would be replaced by the final one.
If you were sending these graphs to a PostScript file, the PS file would
contain 3 separate graphs, each on its own page.
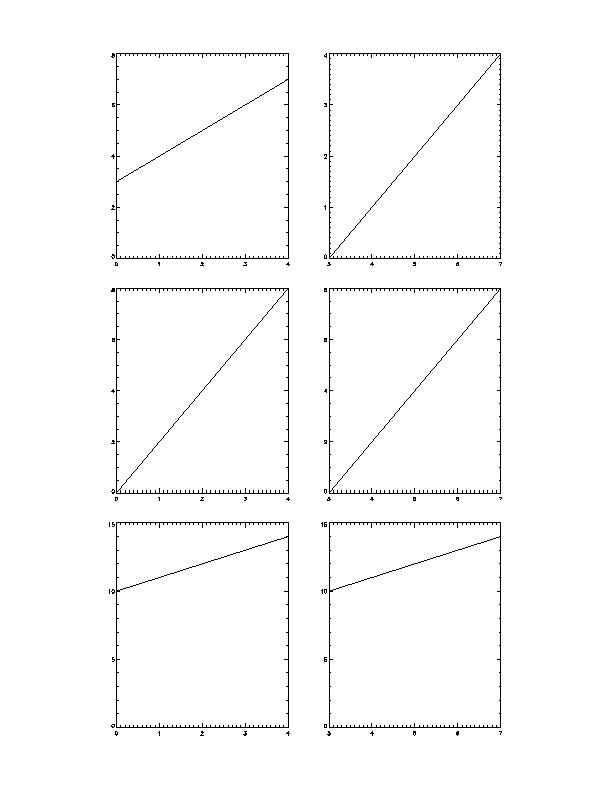 Use
the system variable field, !p.multi to
put several plots on one page. The first element in the vector is
the number of empty sectors remaining on the page (this is normally 0 and
is used when there are a different number of plots in one row or column
than the other). The second element contains the number of plots
per page in the horizontal direction. The third element contains
the number of plots per page in the vertical direction. The fourth
element is for the plots stacked in the Z dimension. And the 5th
element controls the order in which the plots are drawn: 0 makes
the plots go from left to right; 1 makes them go from top to bottom.
The last 2 fields in the !p.multi array and are not necessary to specify.
Use
the system variable field, !p.multi to
put several plots on one page. The first element in the vector is
the number of empty sectors remaining on the page (this is normally 0 and
is used when there are a different number of plots in one row or column
than the other). The second element contains the number of plots
per page in the horizontal direction. The third element contains
the number of plots per page in the vertical direction. The fourth
element is for the plots stacked in the Z dimension. And the 5th
element controls the order in which the plots are drawn: 0 makes
the plots go from left to right; 1 makes them go from top to bottom.
The last 2 fields in the !p.multi array and are not necessary to specify.
Pro multiSet_plot, 'PS'
Device, Filename='multi.ps'
Device, xsize=15, ysize=25, xoffset=3, yoffset=1.5 This statement tells IDL to make the overall area containing the 6 plots approximately the size of a full page. Without it, the 6 graphs would fit in the top half of the page. Note that since inches weren't specified, postscript defaults to centimeters.a = findgen(5)
b = 3+findgen(5)
c = 2*findgen(5)
d = 10+findgen(5)!p.multi=[0,2,3,0,1]
plot, a, b
plot, a, c
plot, a, d
plot, b, a
plot, b, c
plot, b, dDevice, /close_file
end