|
|
|
|
|
|
|
|
|
|
|
|
|
|
|
|
|
|
|
|
|
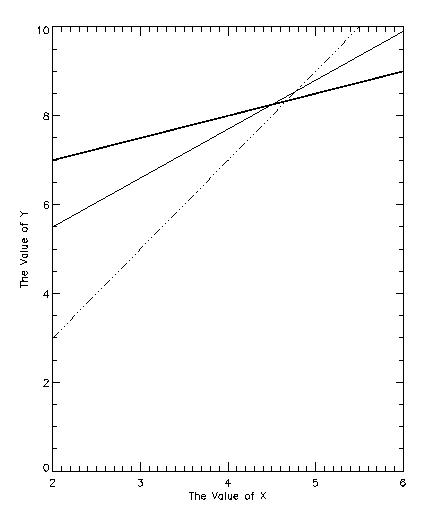
xvalues = [2, 3, 4, 5, 6]
yvalues = [5.5, 6.6, 7.7, 8.8, 9.9]
y2values = [7, 7.5, 8, 8.5, 9]
y3values = [3, 5, 7, 9, 11]
!x.title='The Value of X'
!y.title='The Value of Y'
Plot, xvalues, yvalues, LineStyle=0
OPlot, xvalues, y2values, LineStyle=0, Thick=4
OPlot, xvalues, y3values, LineStyle=4, Thick=2