The Style of the axis can be modified according to the table below:
|
|
|
|
|
|
|
|
|
|
|
|
|
|
|
|
|
|
You can combine more than one setting, such as in the example below:
Plot, xyvalue, yvalues, XStyle=8+1, XRange=[0,9]
Note that because the X axis range was forced (value=1), you must supply
a range for the X axis.
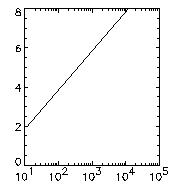
Axes are made logarithmic by simply typing the keyword XLog or YLog with the plot command:
Semi-Log:
A=[12,120,1200,12000]
B=[2,4,6,8]
C=[18,180,1800,18000]
Plot, A, B, /XLOG
Log-Log:
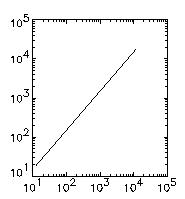
A=[12,120,1200,12000]
B=[2,4,6,8]
C=[18,180,1800,18000]
Plot, A, C, /XLOG, /YLOG
IDL has its own way of defaulting to a series of major and minor tick marks. If you would like to change these, here are some examples:
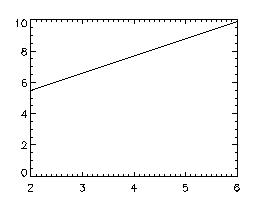
xvalues = [2, 3, 4, 5, 6]
yvalues = [5.5, 6.6, 7.7, 8.8, 9.9]
Plot, xvalues, yvalues
These are the tick marks that IDL chose by default for this graph.
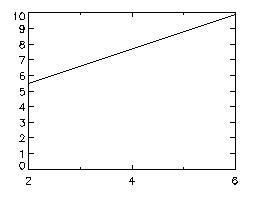
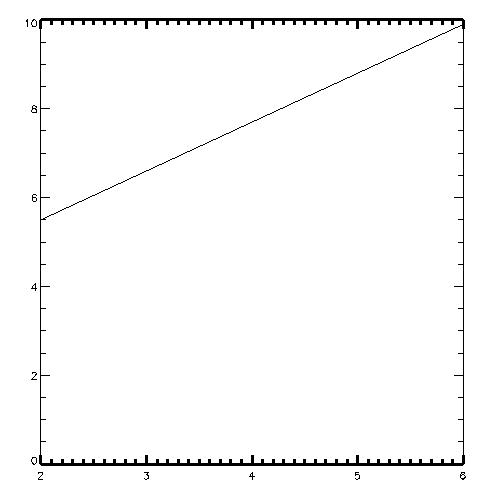
Plot, xvalues, yvalues, $
XTicks=2, XMinor=2, $
YTicks=10, YMinor=1
This is the same graph as above, but the tick marks are forced.
It's not necessarily an improvement, but there may be times when you want
this kind of control. Note that for the Y axis, there is 1 minor
tick specified. Without that, IDL defaulted to 10 minor ticks.
One is the correct number of minor ticks when you really want just major
ticks. Zero doesn't work the way you might think. Notice that
on the X axis the two major tick result in 2 large units. Two minor
ticks result in 2 units between each major unit.
If the default thickness of the axis lines are not suitable, you may change them as follows:
Plot, xvalues, yvalues, $
XThick = 5, YThick = 1.0