


Next: The LDA approximation
Up: Results
Previous: Reliability: eigenvalues
Figures 6 - 9 display various trends across the periodic table,
utilizing the data contained in the tables.
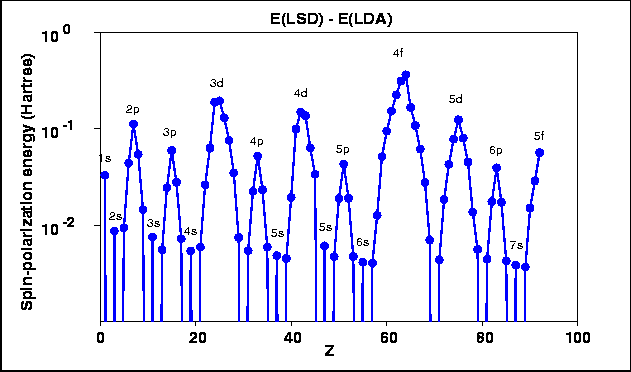
Fig. 6.: Difference of
LDA and
LSD
total energies of neutral atoms, vs. atomic number Z.
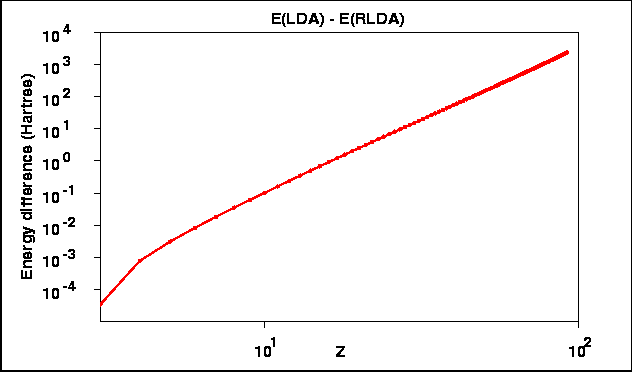
Fig. 7.: Difference of
ScRLDA and
RLDA
total energies of neutral atoms, vs. atomic number Z.
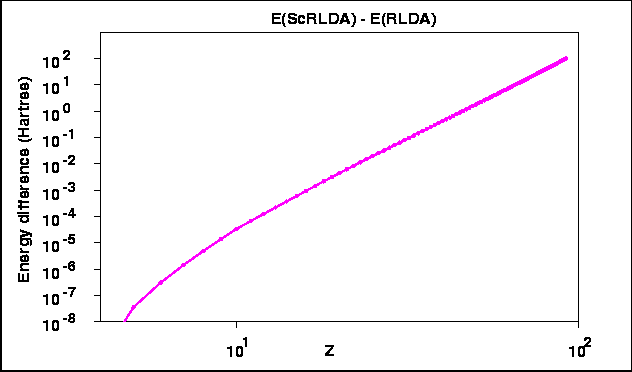
Fig. 8.: Difference of
LDA and
RLDA
total energies of neutral atoms, vs. atomic number Z.
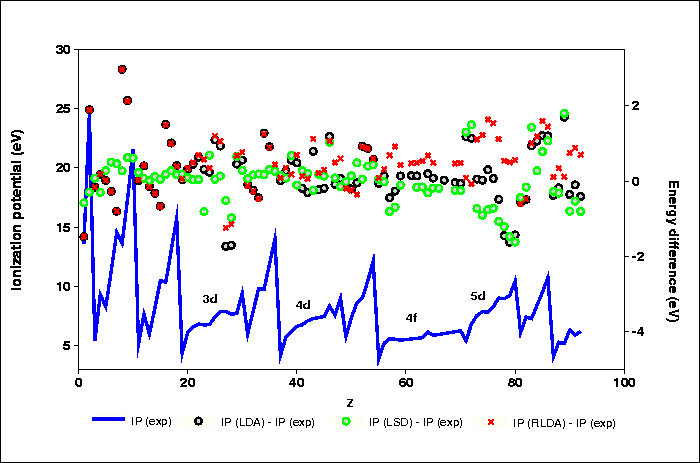
Fig. 9.:
Ionization potentials of the elements, as obtained from
experiment (blue line,
to be referred to scale on left));
and differences of calculated and experimental
values for the
LDA (black),
LSD (green),
and RLDA (red)
approximations, all to be referenced to the right-hand
energy scale.
Next: The LDA approximation
Up: Results
Previous: Reliability: eigenvalues